If in Doubt, Say So
A crowd of volunteers, a detector, and the value of being allowed to say “not sure”
In PV Check, volunteers look at an aerial image that depicts a detected PV systems. The interface draws a box in the center of the image and the question asked to the volunteer is is there a PV panel that overlaps with this square ? Three choices are possible: yes, no, or not sure.
This blog post unwraps the first results coming from the 10,000 first annotations. 165 annotators took part of the collective effort. 971 installations from the database have been validated, accross all departements. This post focuses on how the "not sure" button is informative of the intrinsinc difficulty to detect a PV system.
1. Ten votes, and what they look like
With ten independent votes on each installation, many cases are clear: all ten voters see an installation, or all ten see something else. But other cases are not, and the votes say so: they split, or most voters tell us they can't tell. Here are four of them.
Aerial images © IGN, loaded from the Géoplateforme, with the white square showing the marker voters see in the game.
I use the 971 installations that have collected their full set of 10 votes (9,710 votes in total). To summarize how much the voters hesitate on an installation, I use the entropy of its votes: I express it as a percentage of its maximum: 0% when all ten say the same thing, 100% when the three answers are equally likely.
2. Where it gets interesting: the model's own uncertainty
Is it the same installations that are hard for people and for the model? To find out, I compare the hesitation of the voters with how uncertain the model is. I don't use the model's precision as a score to beat: I use the published precision, recall and F1 of DeepPVMapper in each département as a gauge of how uncertain the model is there.
The estimation of the model uncertainty comes from the recently published preprint that audits the TSO's grid connection data. Click here to learn more about this project.
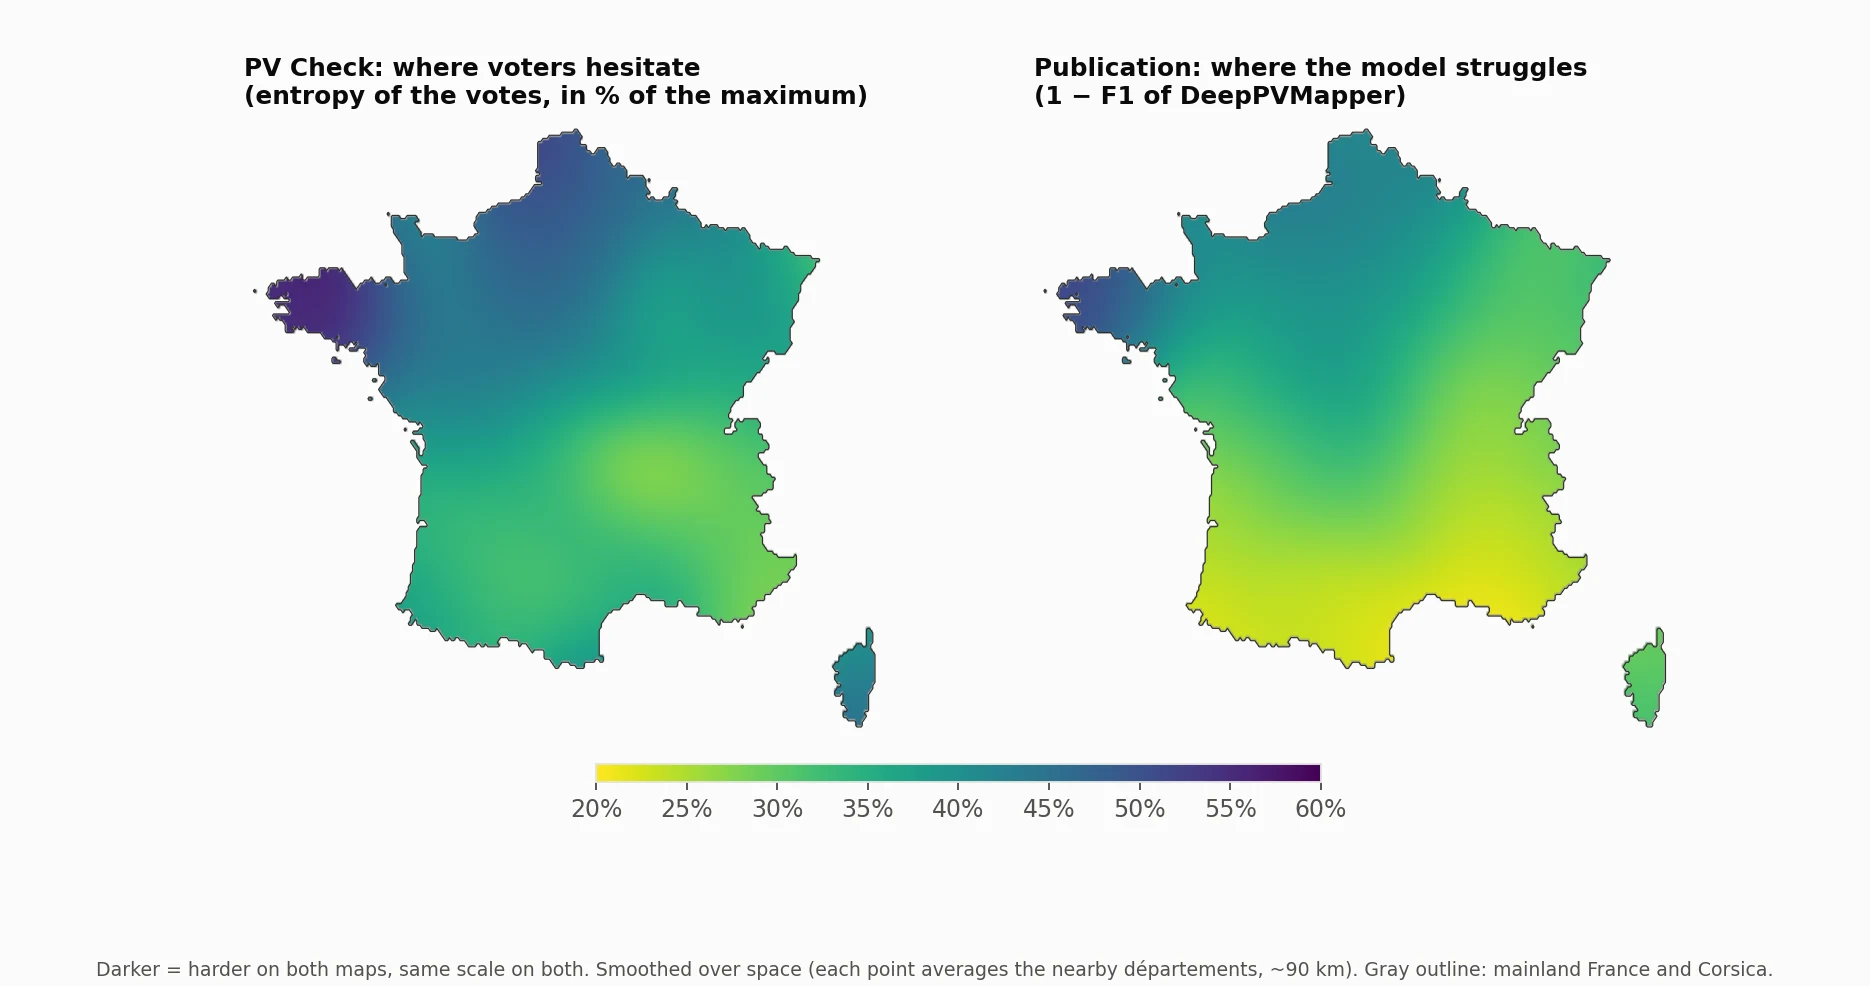
A clear trend appears: the North-West of France, Brittany ahead, is where it is the hardest to find PV systems from aerial images. On the other hand, the South in general and the South-East in particular is the least uncertain, no matter whether you consider a humain or automated rooftop PV detector.
The reason is actually quite straightforward: in Brittany, detecting PV systems on slate roofs with a strong tilt can be challenging. On the other hand, in Provence, PV systems are mouned on tile roofs, against which the they stand out clearly. So, in some places, it is intrinsically more difficult to detect PV systems on RGB images.
Among the reasons for that may simply be that models rely on annotated images. These images were annotated by humans, so the models inherit our own biases and uncertainties. It could be interesting to see if adding other spectral bands could help the model, or if what a model do is eventually bounded by what knowledge humans can distill into the training dataset.
3. When the crowd says no to a confident detector
Another feature that stands out is that humans appear to be more cautious than the model. Is it because the humans are too cautious, or because the model is overconfident. Established work tend to support the latter, but let's find out if we recover that in our data.
Among the installations in the campaign, about half of them (409) feature a confidence score. How reliable is this score ? To find out, we need to see if this score is calibrated : if it says 0.60, then the detector should be right 60% of the time.
The crowd gives us a way to check it, with the caveat that "ten votes, eight yes" is not ground truth, only the verdict of people looking at the same aerial image. Below, I group the 409 installations by score (the scores start at 0.50, since the detector only keeps detections above that) and show how the crowd judged each group.
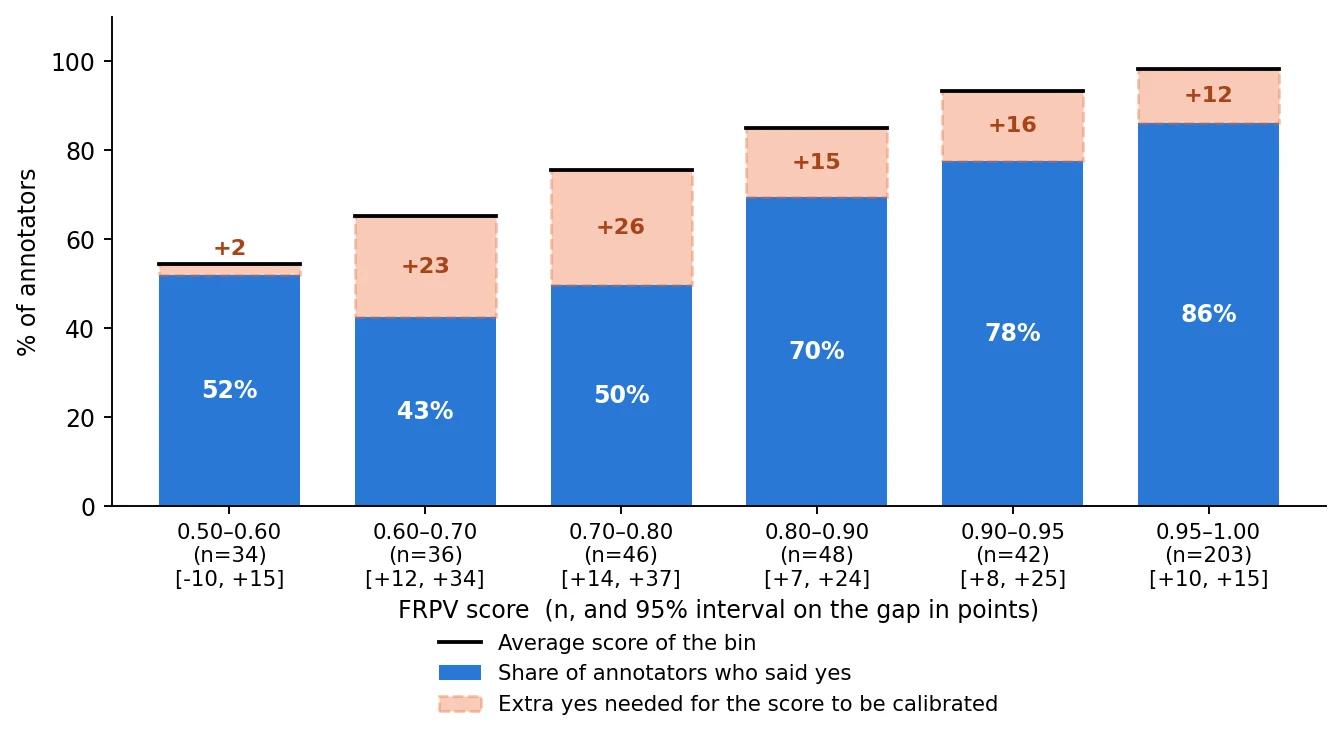
The detector is almost always overconfident: in every bin, fewer annotators say yes than the score announces. The gap is relatively fair at the lowest score (0.50) and at the highest. In between, the situation is quite messy and the score cannot be interpreted as a probability of finding a PV panel. The detector orders its detections reasonably well, but the number it attaches to them is too optimistic, and it is the most wrong where it matters most: when it hesitates.
The worst case of miscalibration is a detector that is very sure and wrong. It is rare, but it happens. Among the 183 detections scored 0.97 or more, four are rejected by the majority of voters (six "no" or more), one of them unanimously. That is 2% of them. At 0.95 or more, it is six detections out of 214, and below 0.70 it is a third of them. Here are the 8 detections scored 0.90 or more that a majority of voters reject.
Aerial images © IGN, loaded from the Géoplateforme, with the white square showing the marker voters see in the game.
It appears that improving the model's calibration should be the next feature for the database, maybe even more than improving its accuracy. I'll keep you posted on the future updates.
In the meantime, the crowdsourcing campaign is still going on. The more calibration data, the best. If you'd like to join, the game is accessible accessible here.
PV Check exists to check, with the help of volunteers, how reliable the detections of a rooftop PV model really are, and to build a reference against which a detector's confidence can be tested. The full story of why it exists and where it is going is discussed in this post.