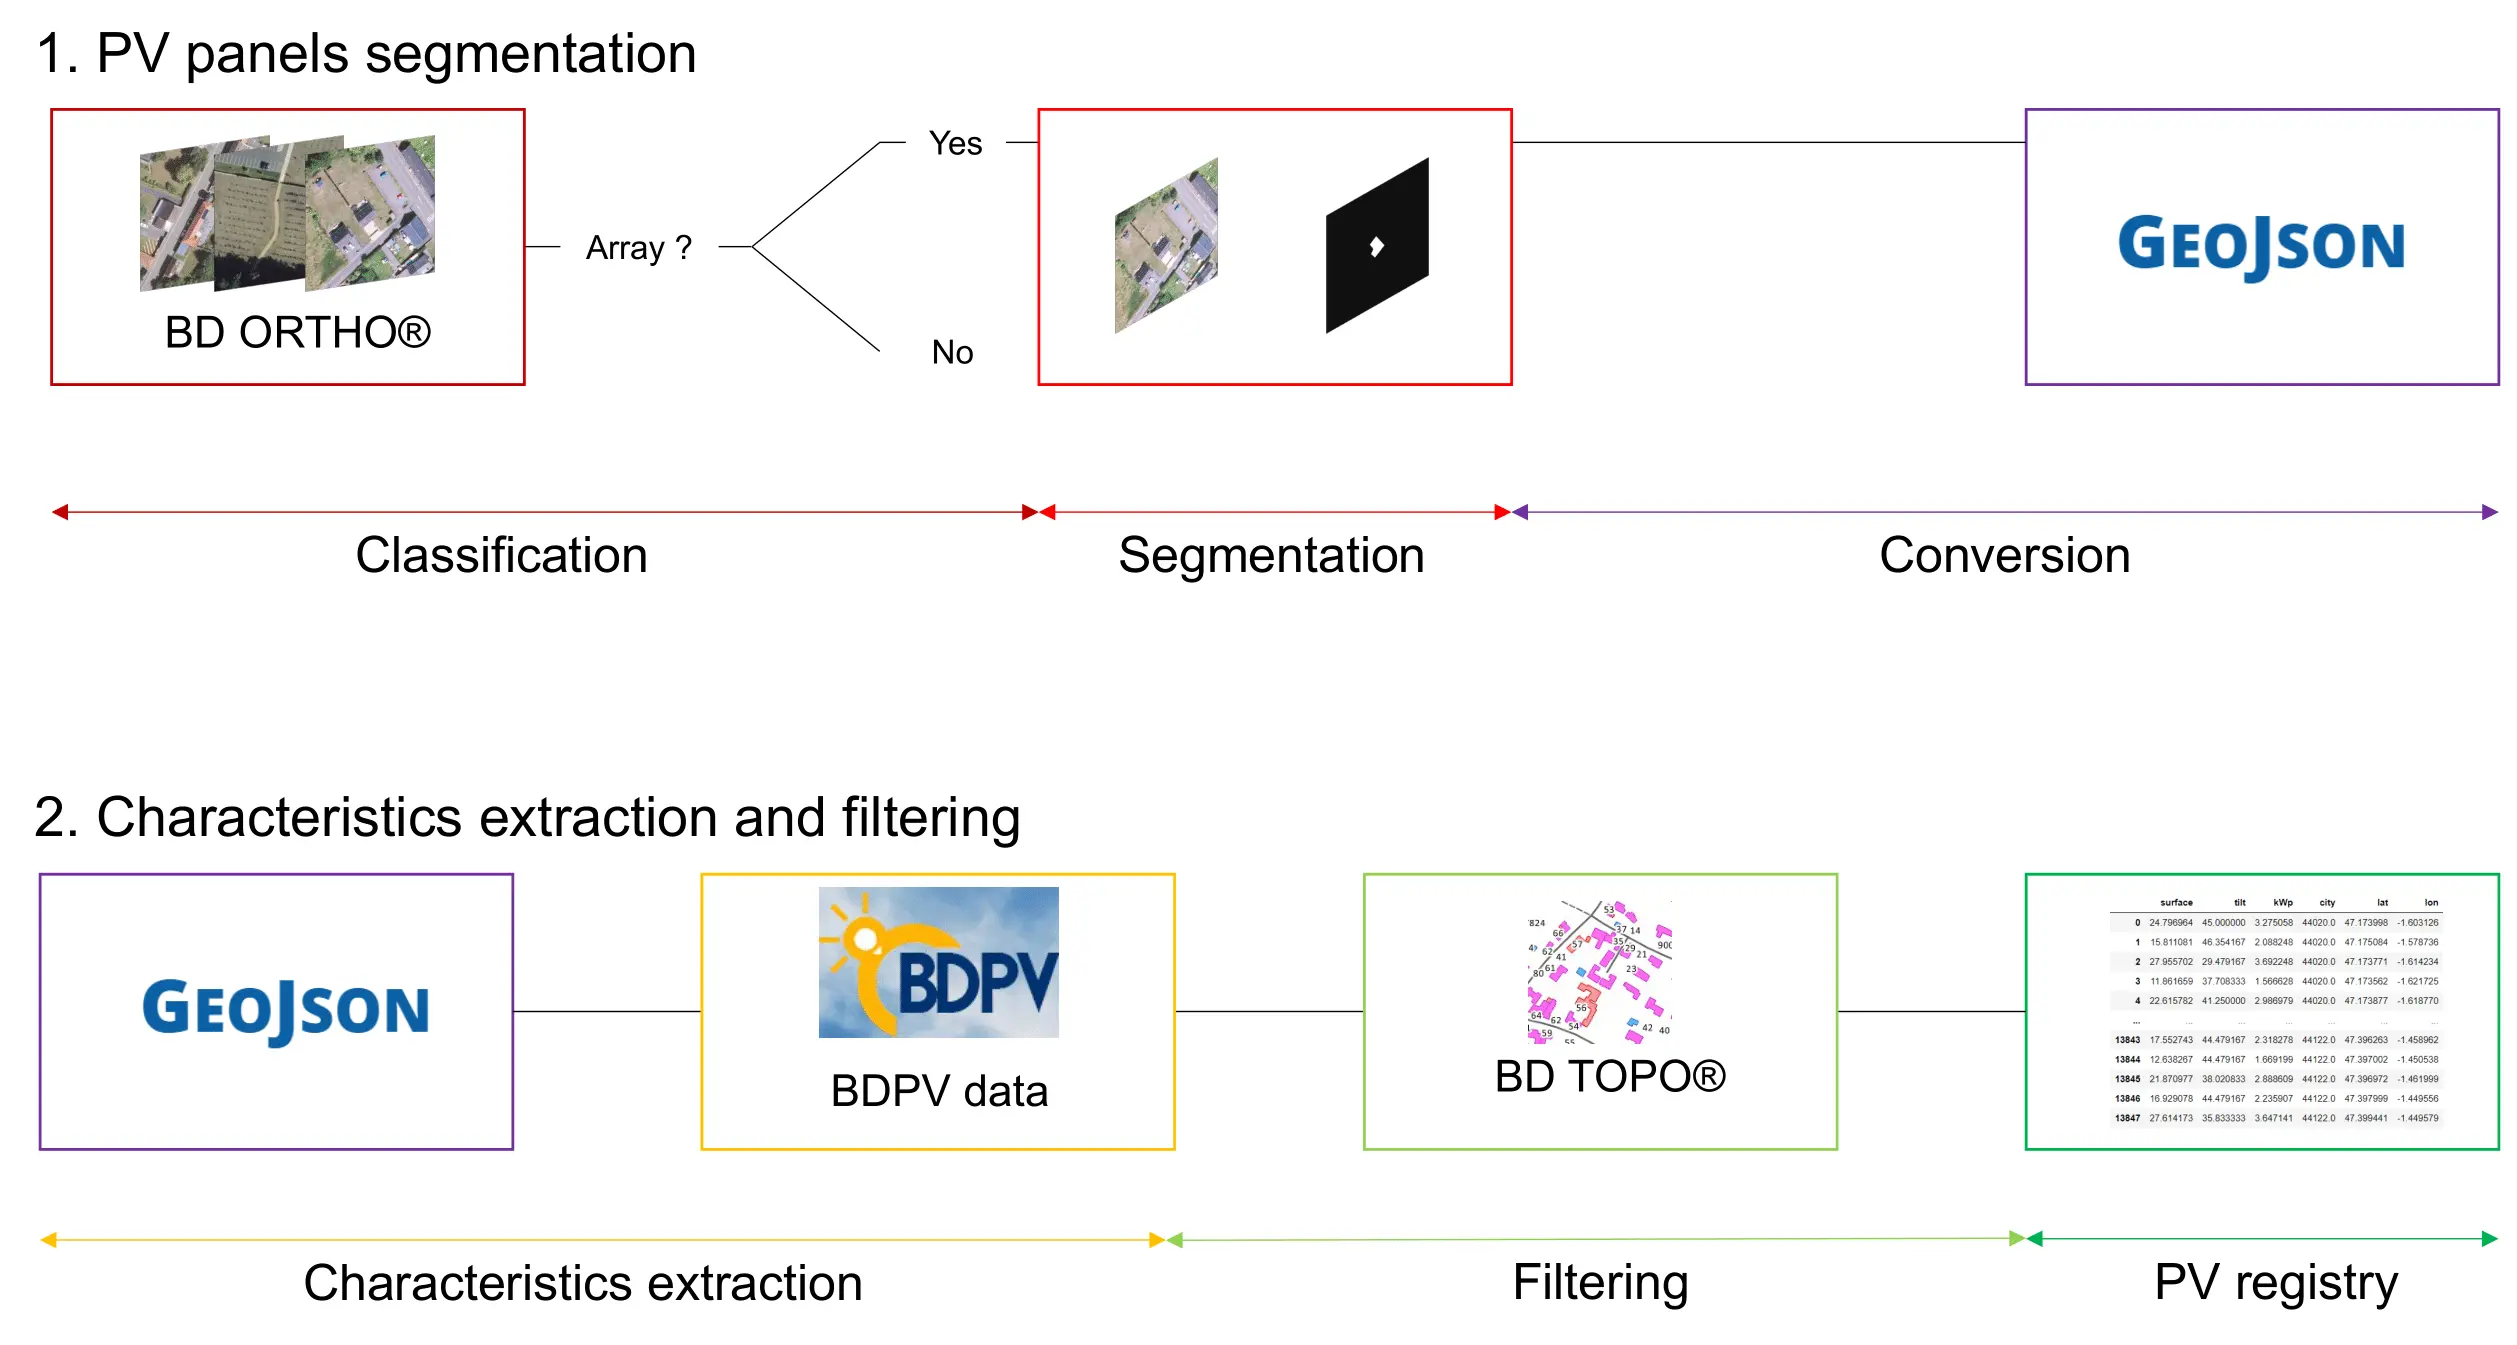
DeepPVMapper is a deep learning pipeline, inspired by 3D-PV-Locator (Meyer et al., 2022), that
detects rooftop photovoltaic systems from aerial imagery and characterizes them. It proceeds in
two stages: polygon extraction, and characteristics extraction.
Overview of the DeepPVMapper pipeline, from aerial tiles to a characterized PV registry
1.1Polygon Extraction
Aerial tiles are first divided into patches and passed through a
classification model (Inception v3) that flags patches likely to contain a PV
installation. Positively classified patches are then passed to a
segmentation model (DeepLab v3), which extracts precise polygon boundaries for each
detected system. This two-step classify-then-segment design keeps the pipeline computationally
tractable at national scale, since the costly segmentation step only runs on the small fraction of
patches the classifier flags as positive.
1.2Characteristics Extraction
The extracted polygons are processed with pypvroof, a package developed for this
project and published on PyPI,
which estimates each system's surface area, tilt, orientation (azimuth), and installed capacity.
Detections are then cross-referenced with BD TOPO®, IGN's national building
database, in a cleanup & filtering step that (i) keeps only detections that sit on rooftops and
(ii) merges multiple detections belonging to the same roof into a single system. The result is a
clean, geolocated PV registry, with one entry per physical installation and its
estimated characteristics.
2.Training
2.1Training Data
The models are trained on BDAPPV, a dataset of aerial images of rooftop PV
installations in France and Belgium, with segmentation masks and installation metadata.
Images are provided by two aerial imagery providers — Google and
IGN — for a total of 45,733 images, making the
dataset suitable for both segmentation/classification benchmarks and distribution shift
evaluation across imagery sources. All images are 400×400 px PNGs, with binary
PNG segmentation masks at the same resolution; the Google set is a superset of the IGN one,
i.e. every IGN installation also has a corresponding Google image. For DeepPVMapper, since
deployment runs on IGN's BD ORTHO® imagery, the models are trained specifically on the
IGN subset (17,325 images, including 7,685 positive samples).
Provider
Images
Positives (masks)
Negatives
Note
Google
28,408
13,303
15,105
399 images excluded (no metadata entry)
IGN
17,325
7,685
9,640
–
BDAPPV dataset composition. Kasmi et al., Scientific Data, 2023.
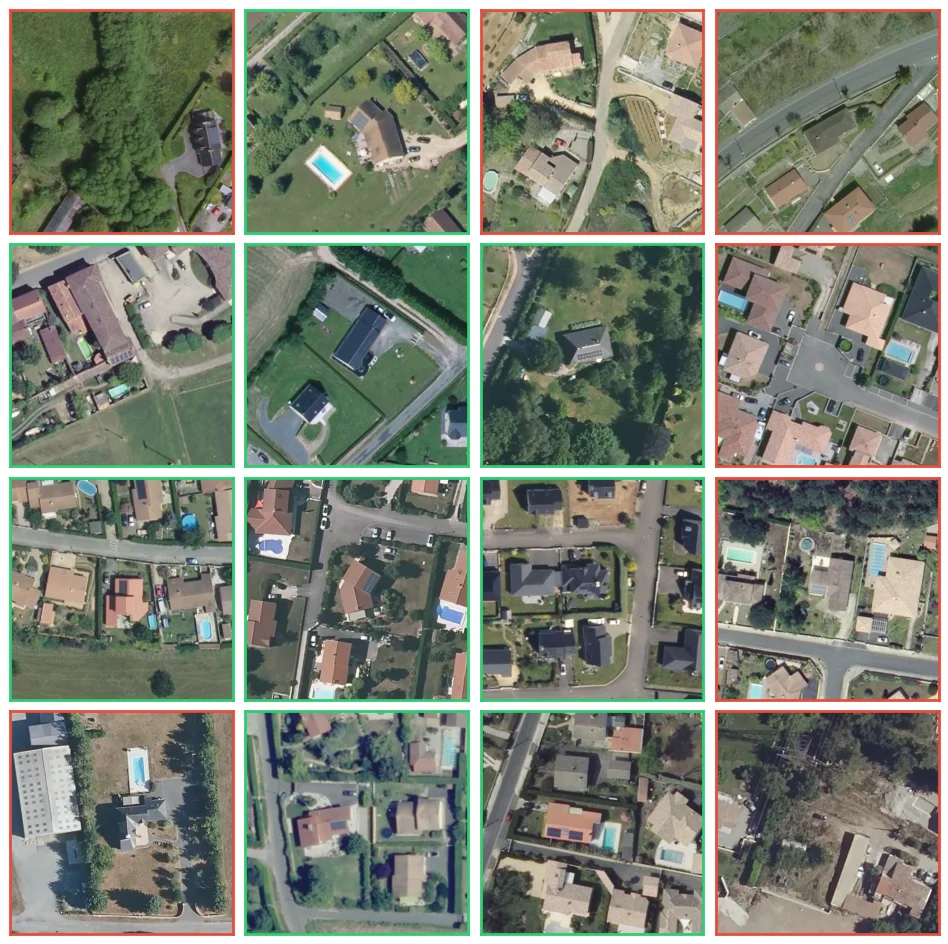
Sample images (IGN images) from the BDAPPV dataset.
2.2Training Results
The table below, reproduced from Kasmi et al. (2022), benchmarks the classification and
segmentation accuracy of our models against comparable works from the literature. The ground
sampling distance (GSD) indicates how detailed the imagery is — the lower the GSD, the
more detailed the image. PV panels generally cannot be detected on images with a GSD greater
than 30 cm/pixel.
Work
Classification F1-score
Segmentation IoU
GSD (cm/pixel)
Mayer et al.
0.87
0.74
10
Malof et al.
–
0.67
30
Zech & Ranalli
0.82
–
10
Parhar et al.
0.97
0.86
10
Ours
0.84
0.86
20
Table 2 (Kasmi et al., 2022). Classification and segmentation accuracy
— full references for each work are listed in the References section below.
3.Deployment
3.1Key Facts
The pipeline has been deployed across all of metropolitan France. On our hardware,
processing one département takes roughly 10 hours, i.e. an estimated
~1,000 hours (about 42 days) of compute for the full national deployment. This is a
rough estimate: it does not account for the overhead caused by crashes, duplicated runs to obtain
longitudinal data, duplicated runs to clean or update the data, or the time spent
uploading/offloading the aerial imagery.
3.2Validation
The pipeline was validated against 34,081 manually checked samples, allowing the
computation of precision, recall and F1-score for each département.
To evaluate the recall of the algorithm, we retrieved and cleaned PV plants labels from OpenStreetMap
(accounting 8,000 detections) and manually labled the remaining 3,000 systems, depending on our needs.
DeepPVMapper was then deployed on these images to estimate the recall. The precision was evaluated by
manually labelling the model's own predictions. We labeled a total of 23,014 detections.
The number of validation samples for the precision and recall was decided so that
sample size per département is chosen so that the resulting precision and recall estimates carry
a ±10% confidence interval around their true value,
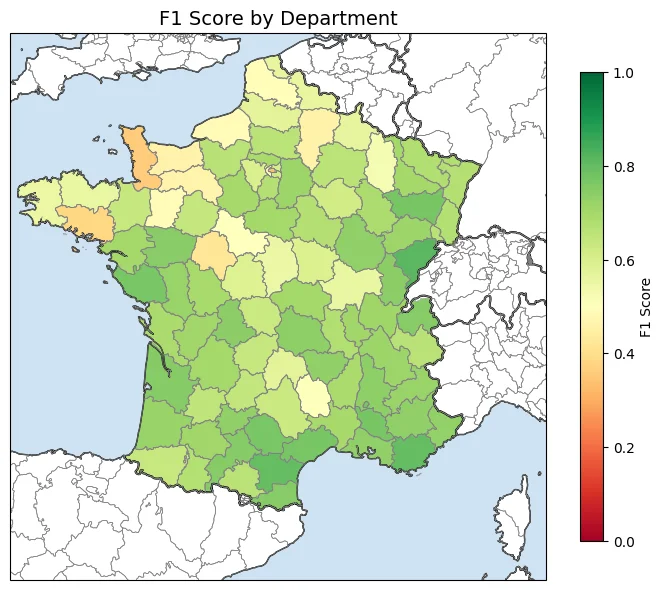
The resulting F1 score ranges from 0.28 to 0.81, with a mean score of 0.65 at the national scale.
Highest accuracy is achieved in the south of France (average F1 score of 0.75 in the region
Provence-Alpes-Côte-d'Azur, followed by 0.70 in Occitanie). The lowest scores are achieved in
Normandie (0.49) and in Paris. Most of the variability actually comes from the precision: the number
of false positives skyrockets in densely urbanized areas (e.g., Paris), while the low precision in
Normandie is caused by farm buildings with metal roofs that the model confuses with
PV arrays.
For comparison, Malof et al. (2019) reported a precision of 0.88, a recall of 0.83 and an
F1-score of 0.85 over an area of about 12,000 km²; a comparable area in our case — e.g.
the Gironde, one of the largest French départements — reaches a precision of 0.87 and a recall
of 0.65. More importantly, this validation effort is, to our knowledge, unprecedented in scale for
rooftop PV remote sensing: the Connecticut/California validation in Malof et al. (2019) was until now
the largest published benchmark for this task.
F1-score of the detection pipeline by département, computed on 23k validation samples.
3.3Results
After curation, the raw output of the pipeline counts 451,883 individual PV systems,
totalling 2,305,669.3 kWp of installed capacity. Because the pipeline's precision
and recall are imperfect — and vary by département — this raw count is a biased estimate of
the true number of installations and the true installed capacity. We therefore use the validation results
above to produce corrected (bias-corrected) estimates.
The correction relies on a bootstrap procedure. For each département \(k\), the true positives,
false positives and false negatives observed in the manual annotations —
\(\text{TP}_k\), \(\text{FP}_k\) and \(\text{FN}_k\) — define a posterior belief about that
département's precision and recall, modelled as
The national precision (resp. recall) is then defined as the weighted average of the departmental
precisions (resp. recalls), each département being weighted by its estimated installed capacity, and
the national F1-score as the harmonic mean of the two. We run 10,000 iterations in which a precision
and a recall value are drawn for every département from these Beta distributions, the national
weighted averages and F1-score are recomputed, and the installed capacity is corrected as
where \(\text{est\_capacity}\) is the raw, uncorrected installed capacity estimated by the pipeline,
and \(p\) and \(r\) denote the (national or departmental) precision and recall. This procedure yields
a full distribution — and therefore confidence intervals — for the corrected number of
installations and installed capacity. The same bootstrap (10,000 draws) is run independently for each
département, producing departmental-level corrected distributions and confidence intervals.
Note that this correction is only valid under an homogeneity assumption: the model
must not make systematically different errors across installation size classes. If, say, it
under-detects large installations more often than small ones, a uniform precision/recall correction
would not fully remove the bias in the corrected capacity.
Applying this procedure at the national level raises the raw count of 451,883
installations to a corrected estimate of 528,199 systems (99% CI:
[516,666; 540,434]), and the raw capacity of 2,305,669.3 kWp to a corrected
estimate of 2,691,920.5 kWp (99% CI: [2,636,215.5; 2,757,490.0]).
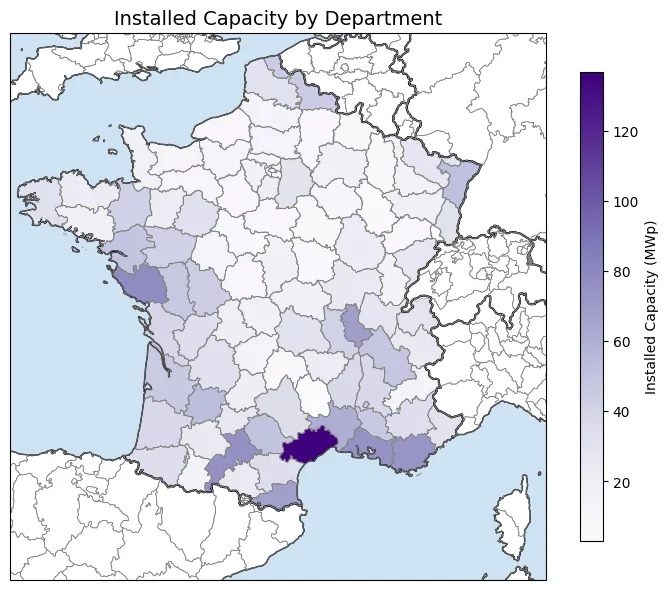
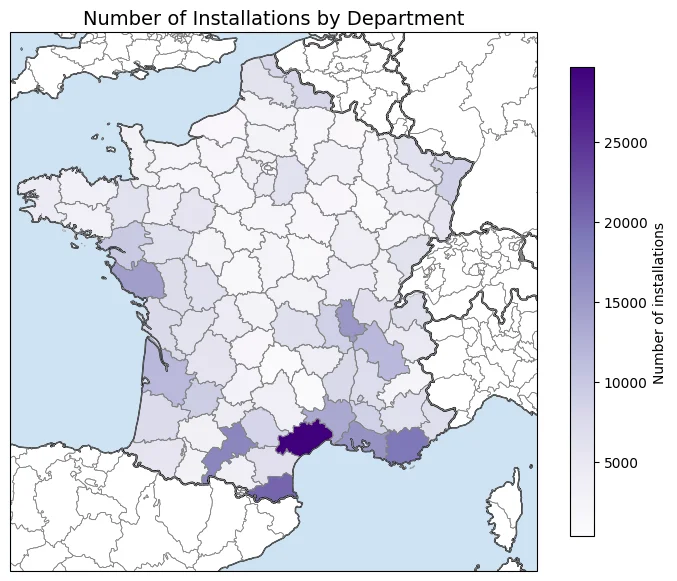
Estimated installed capacity by départementNumber of detected PV systems by département
520k+PV systems mapped
2.7 GWpEstimated installed capacity
34kManually checked validation samples
References
Mayer, J., Rausch, B., Arlt, M.-L., Gust, G., Wang, Z., Neumann, D., & Rajagopal, R. (2022). 3D-PV-Locator: Large-scale detection of rooftop-mounted photovoltaic systems in 3D. Applied Energy, 310, 118469.
Malof, J. M., Li, B., Huang, B., Bradbury, K., & Stretslov, A. (2019). Mapping solar array location, size, and capacity using deep learning and overhead imagery. arXiv preprint arXiv:1902.10895.
Zech, M., & Ranalli, J. (2020). Predicting PV areas in aerial images with deep learning. In 2020 47th IEEE Photovoltaic Specialists Conference (PVSC) (pp. 0767–0774). IEEE.
Parhar, P., Sawasaki, R., Todeschini, A., Reed, C., Vahabi, H., Nusaputra, N., & Vergara, F. (2021). HyperionSolarNet: Solar panel detection from aerial images. In NeurIPS 2021 Workshop on Tackling Climate Change with Machine Learning.
Kasmi, G., Saint-Drenan, Y. M., Trebosc, D., Jolivet, R., Leloux, J., Sarr, B., & Dubus, L. (2023). A crowdsourced dataset of aerial images with annotated solar photovoltaic arrays and installation metadata. Scientific Data, 10, 59.
Trémenbert, Y., Kasmi, G., Dubus, L., Saint-Drenan, Y. M., & Blanc, P. (2023). PyPVRoof: a Python package for extracting the characteristics of rooftop PV installations using remote sensing data. arXiv preprint arXiv:2309.07143.
Kasmi, G., Dubus, L., Blanc, P., & Saint-Drenan, Y. M. (2022). Towards unsupervised assessment with open-source data of the accuracy of deep learning-based distributed PV mapping. arXiv preprint arXiv:2207.07466.