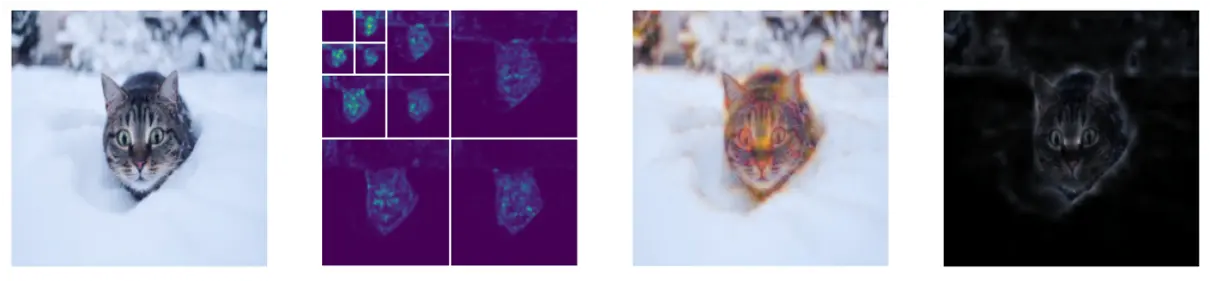
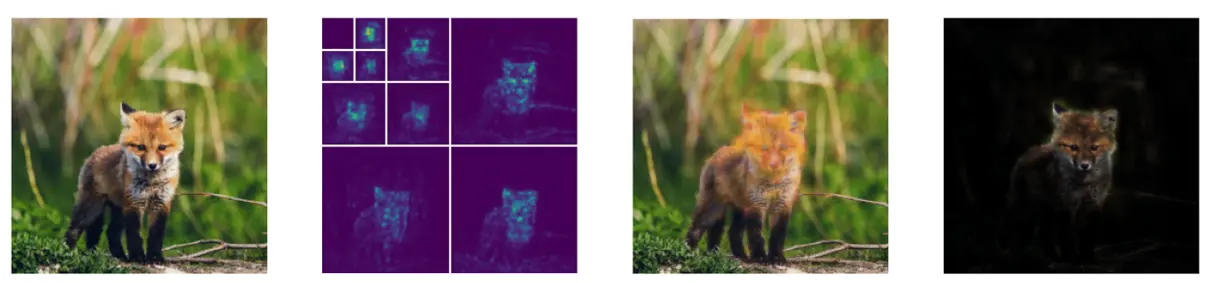
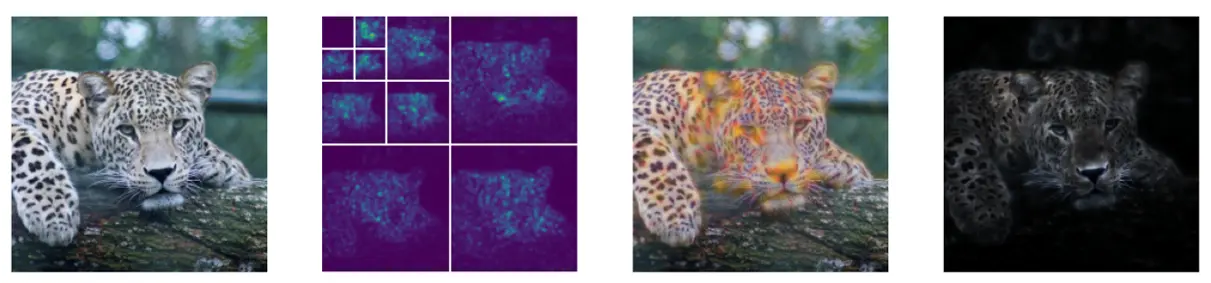
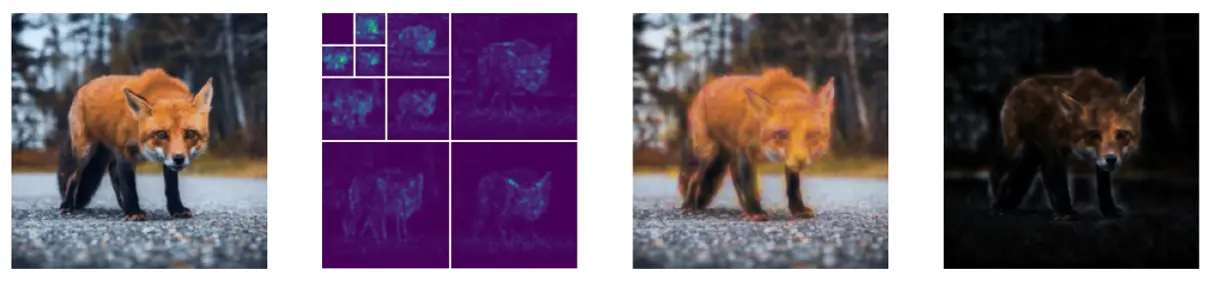
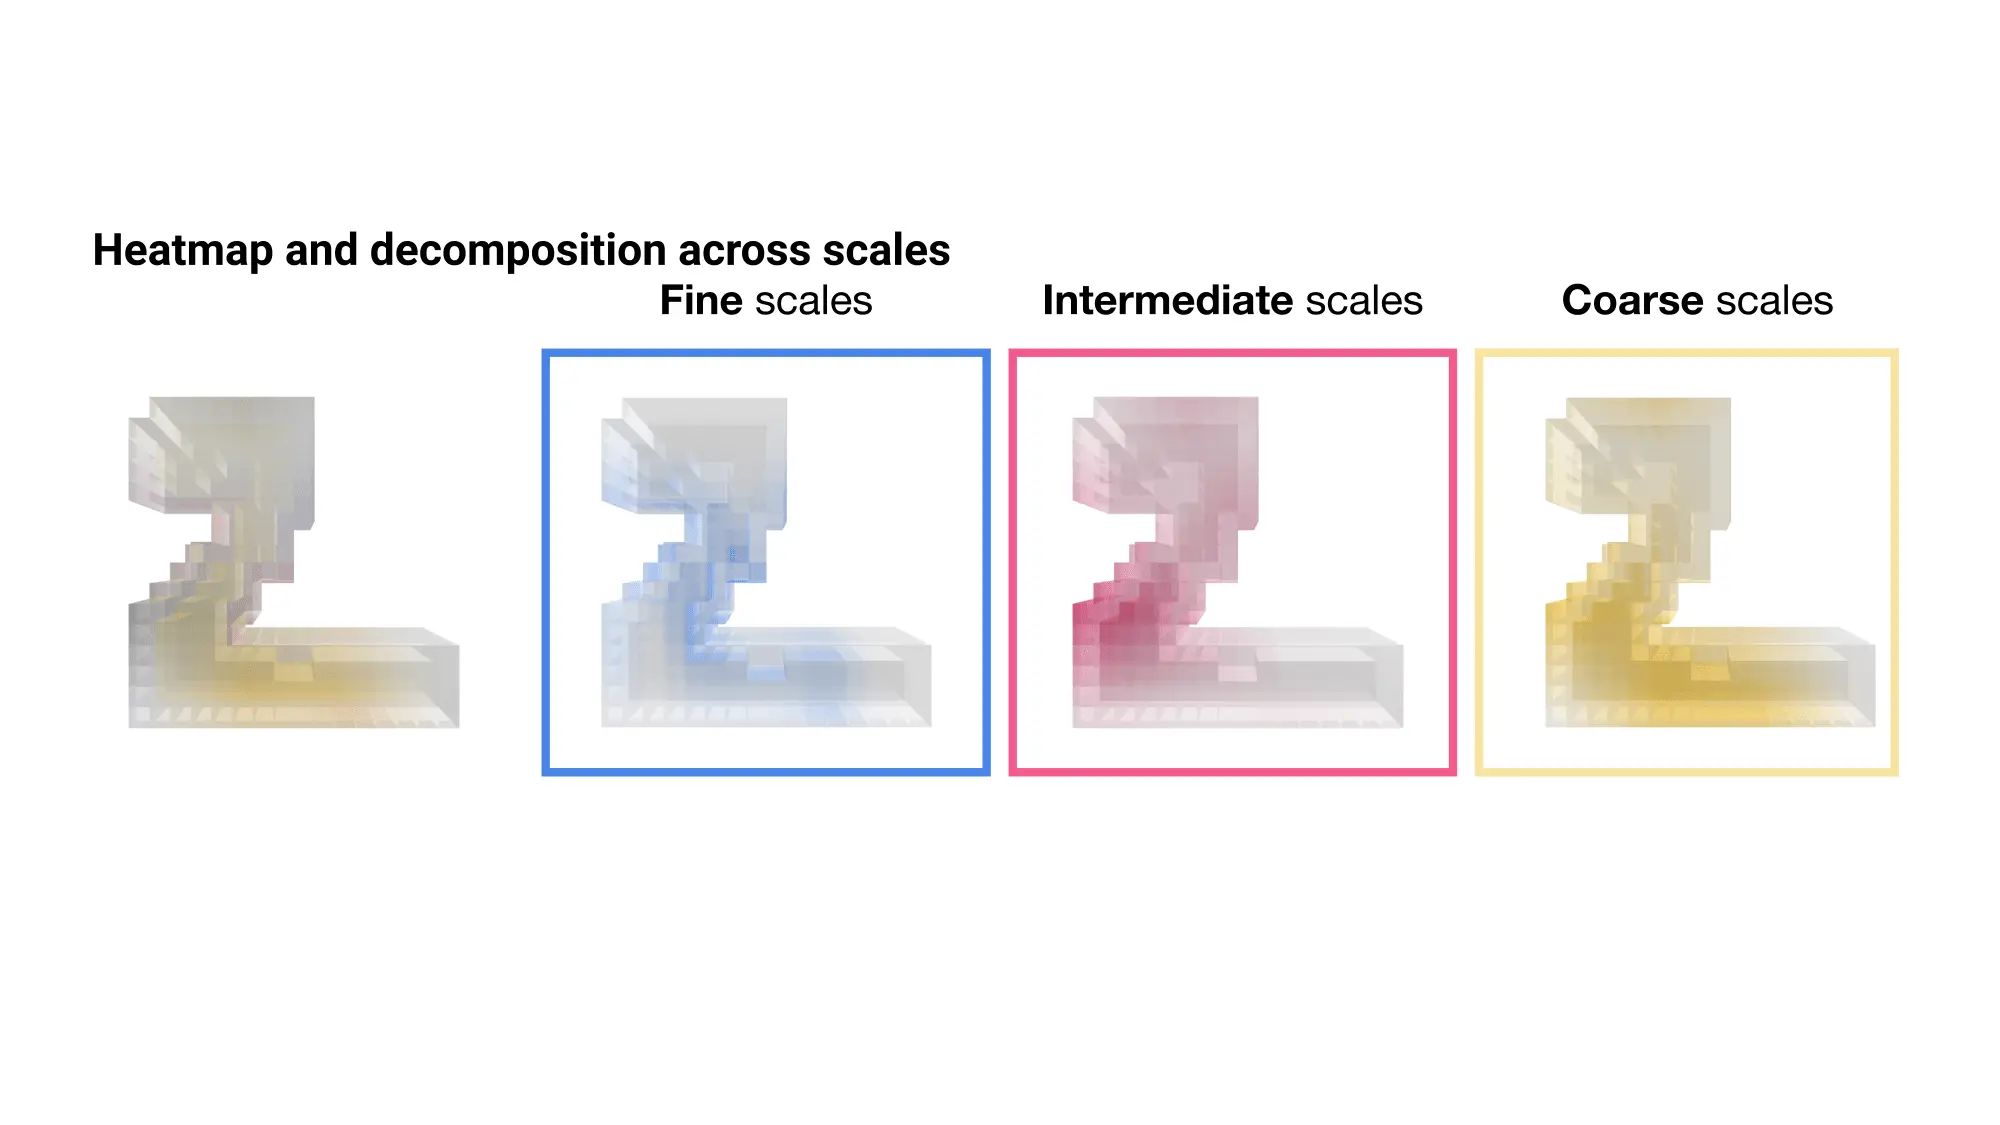
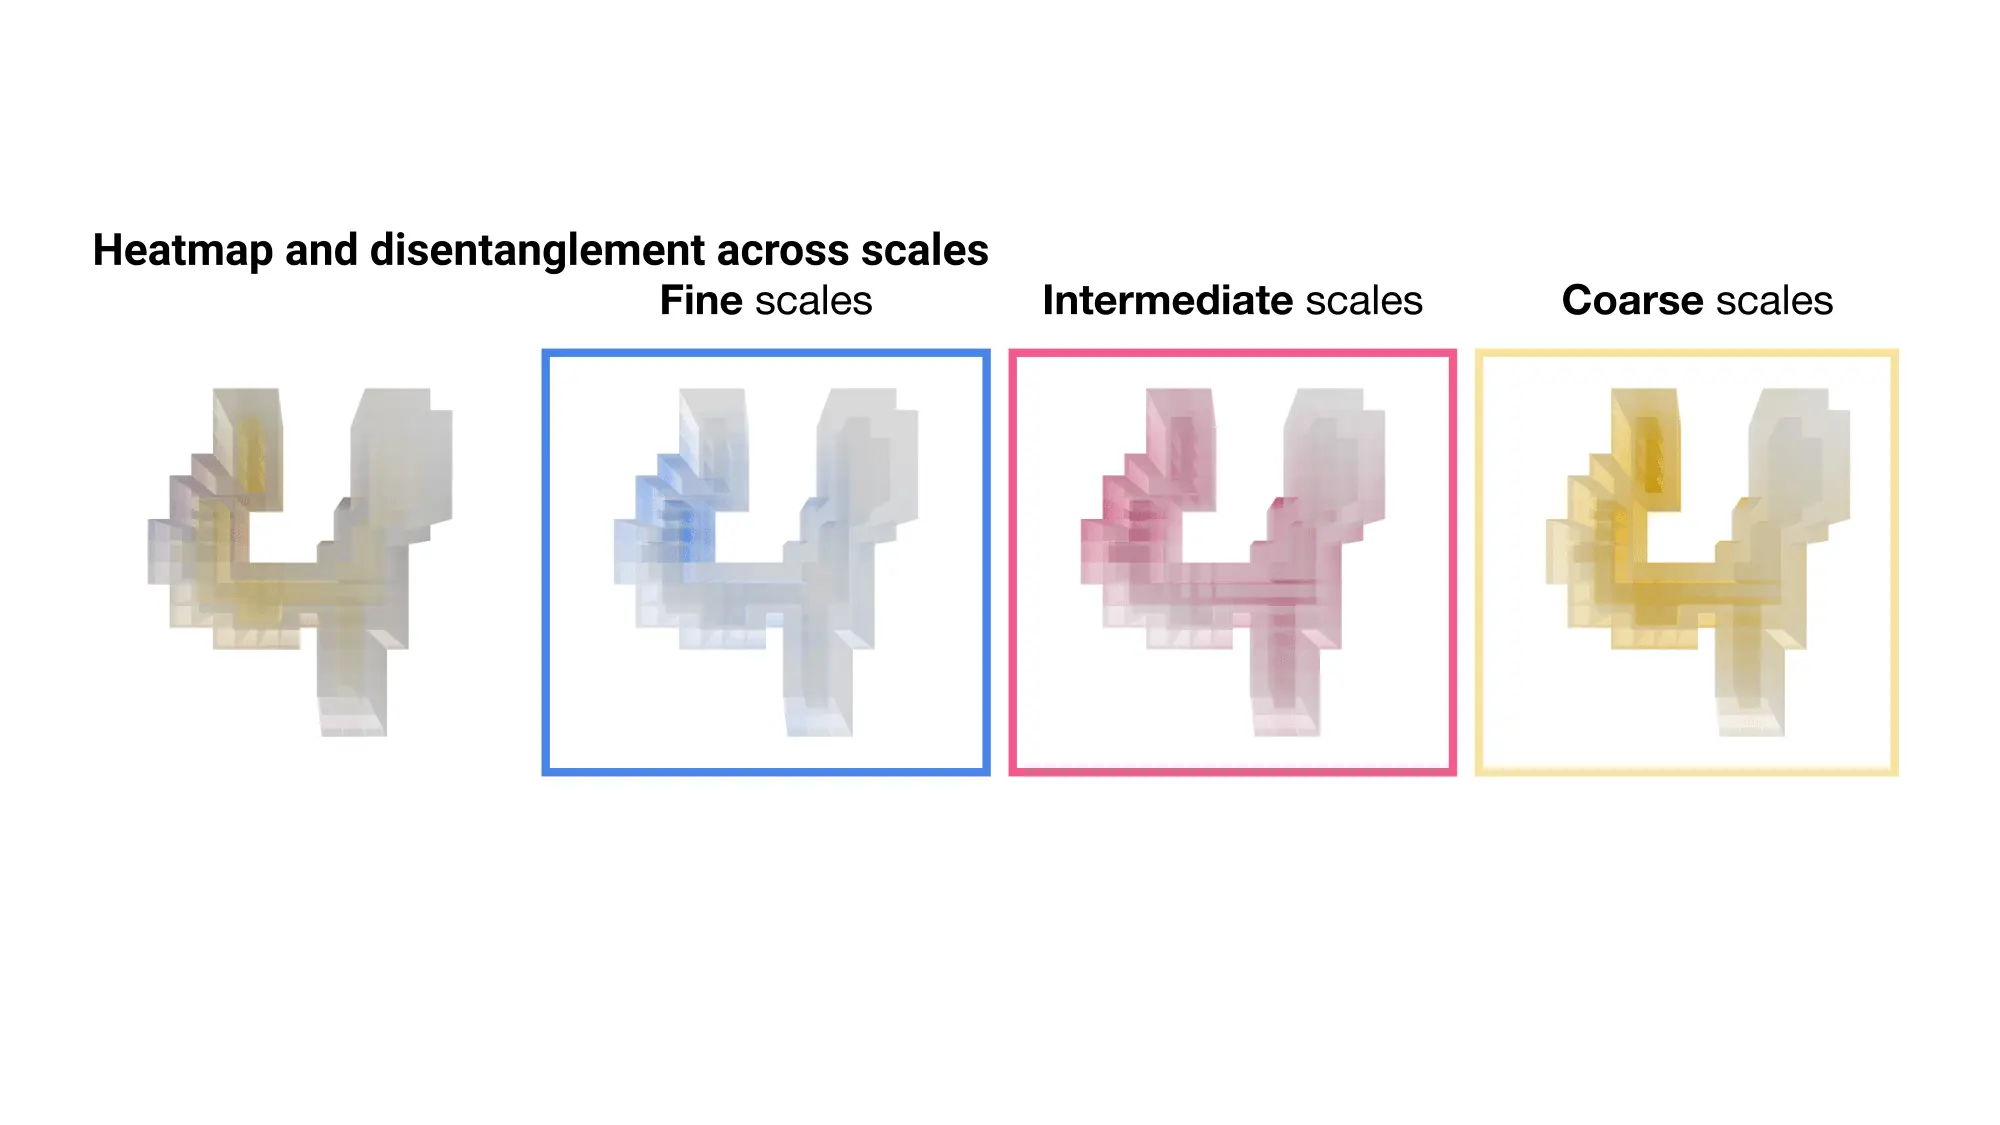
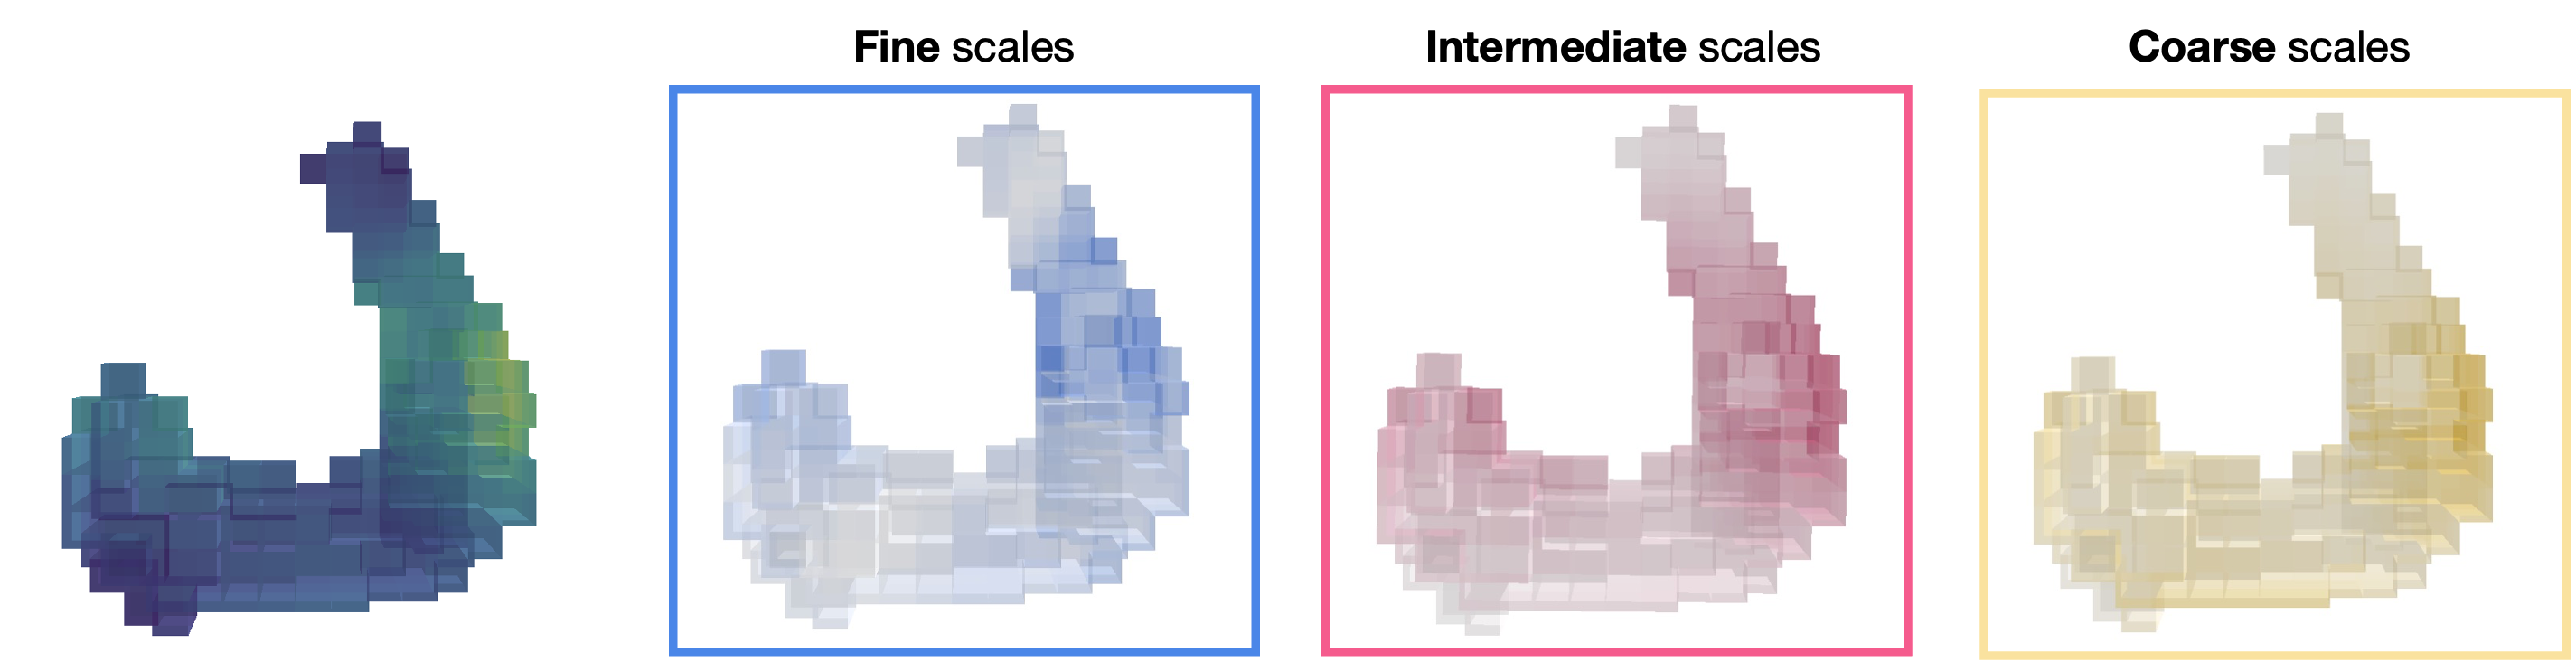
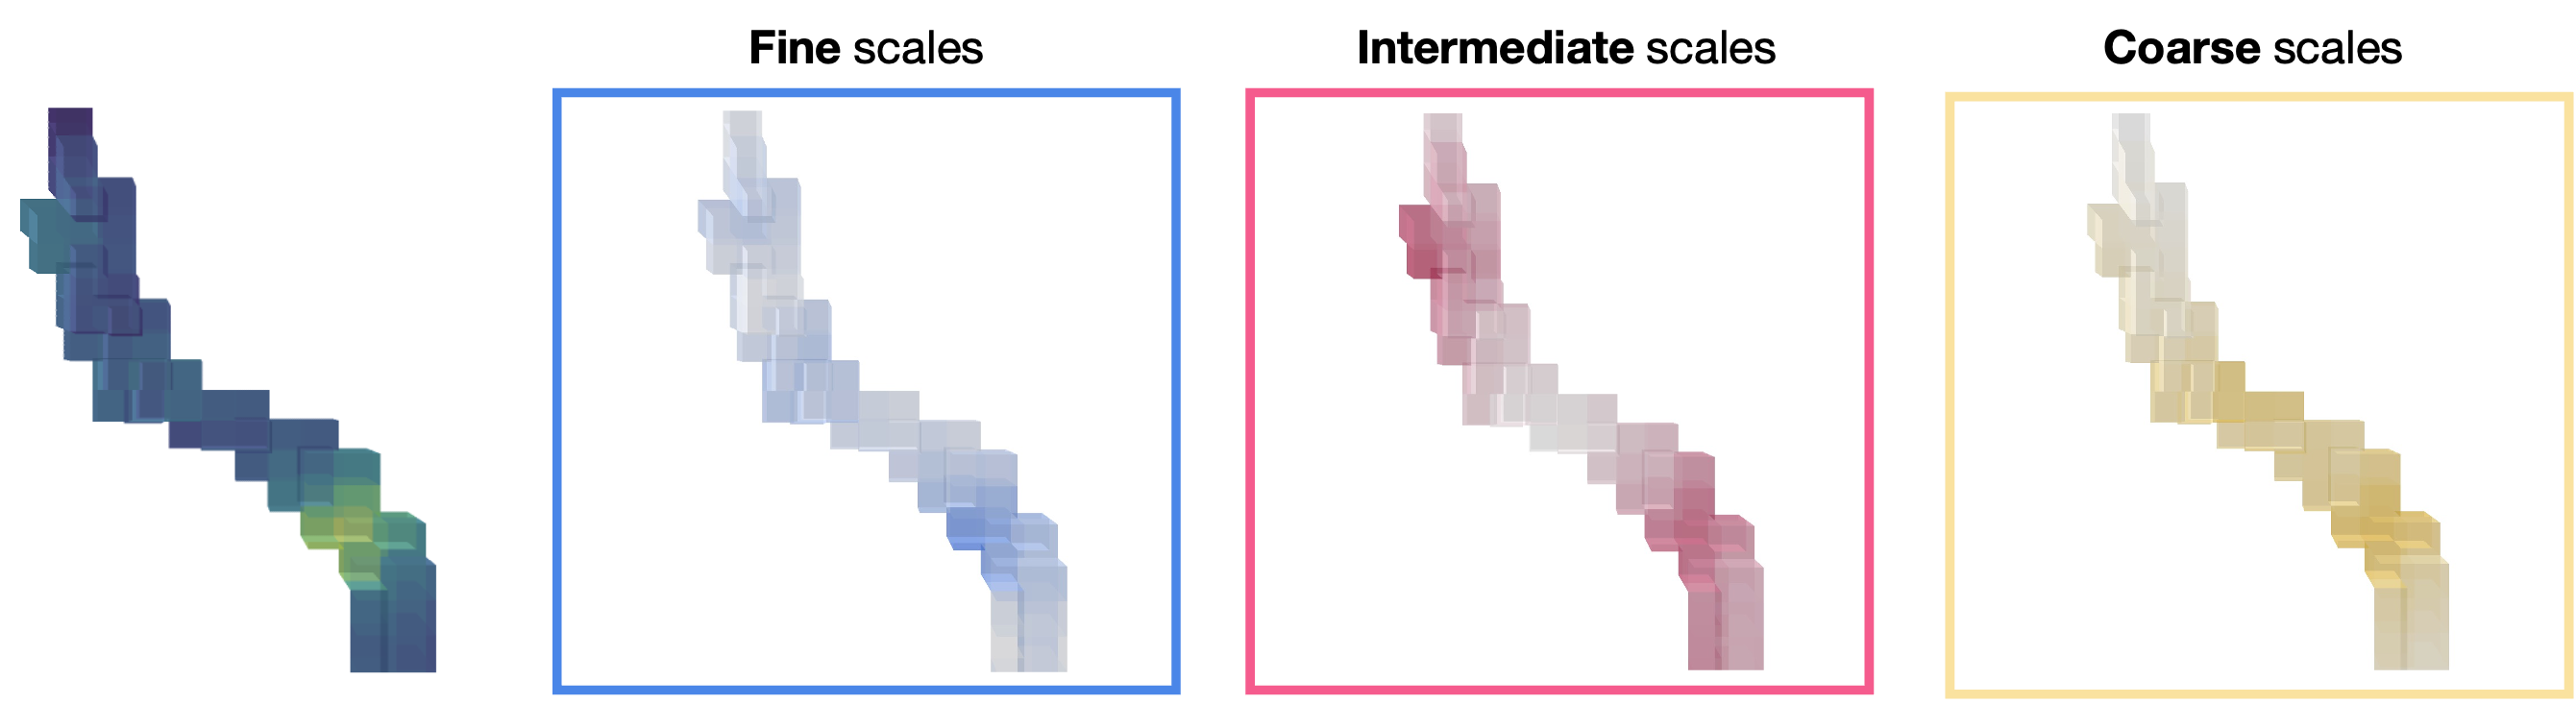
WAM visualizations
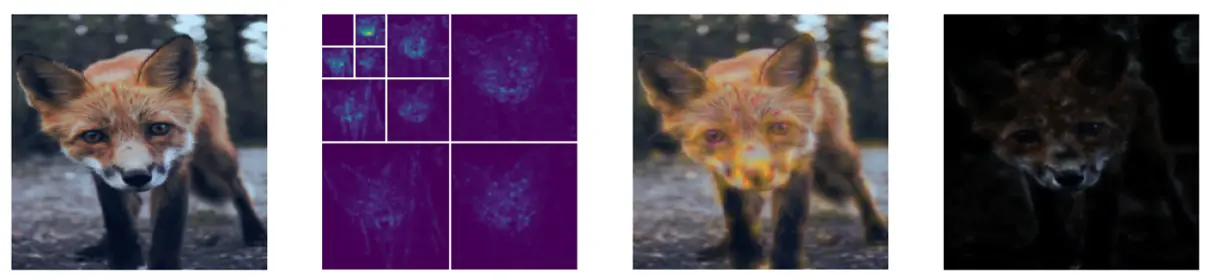
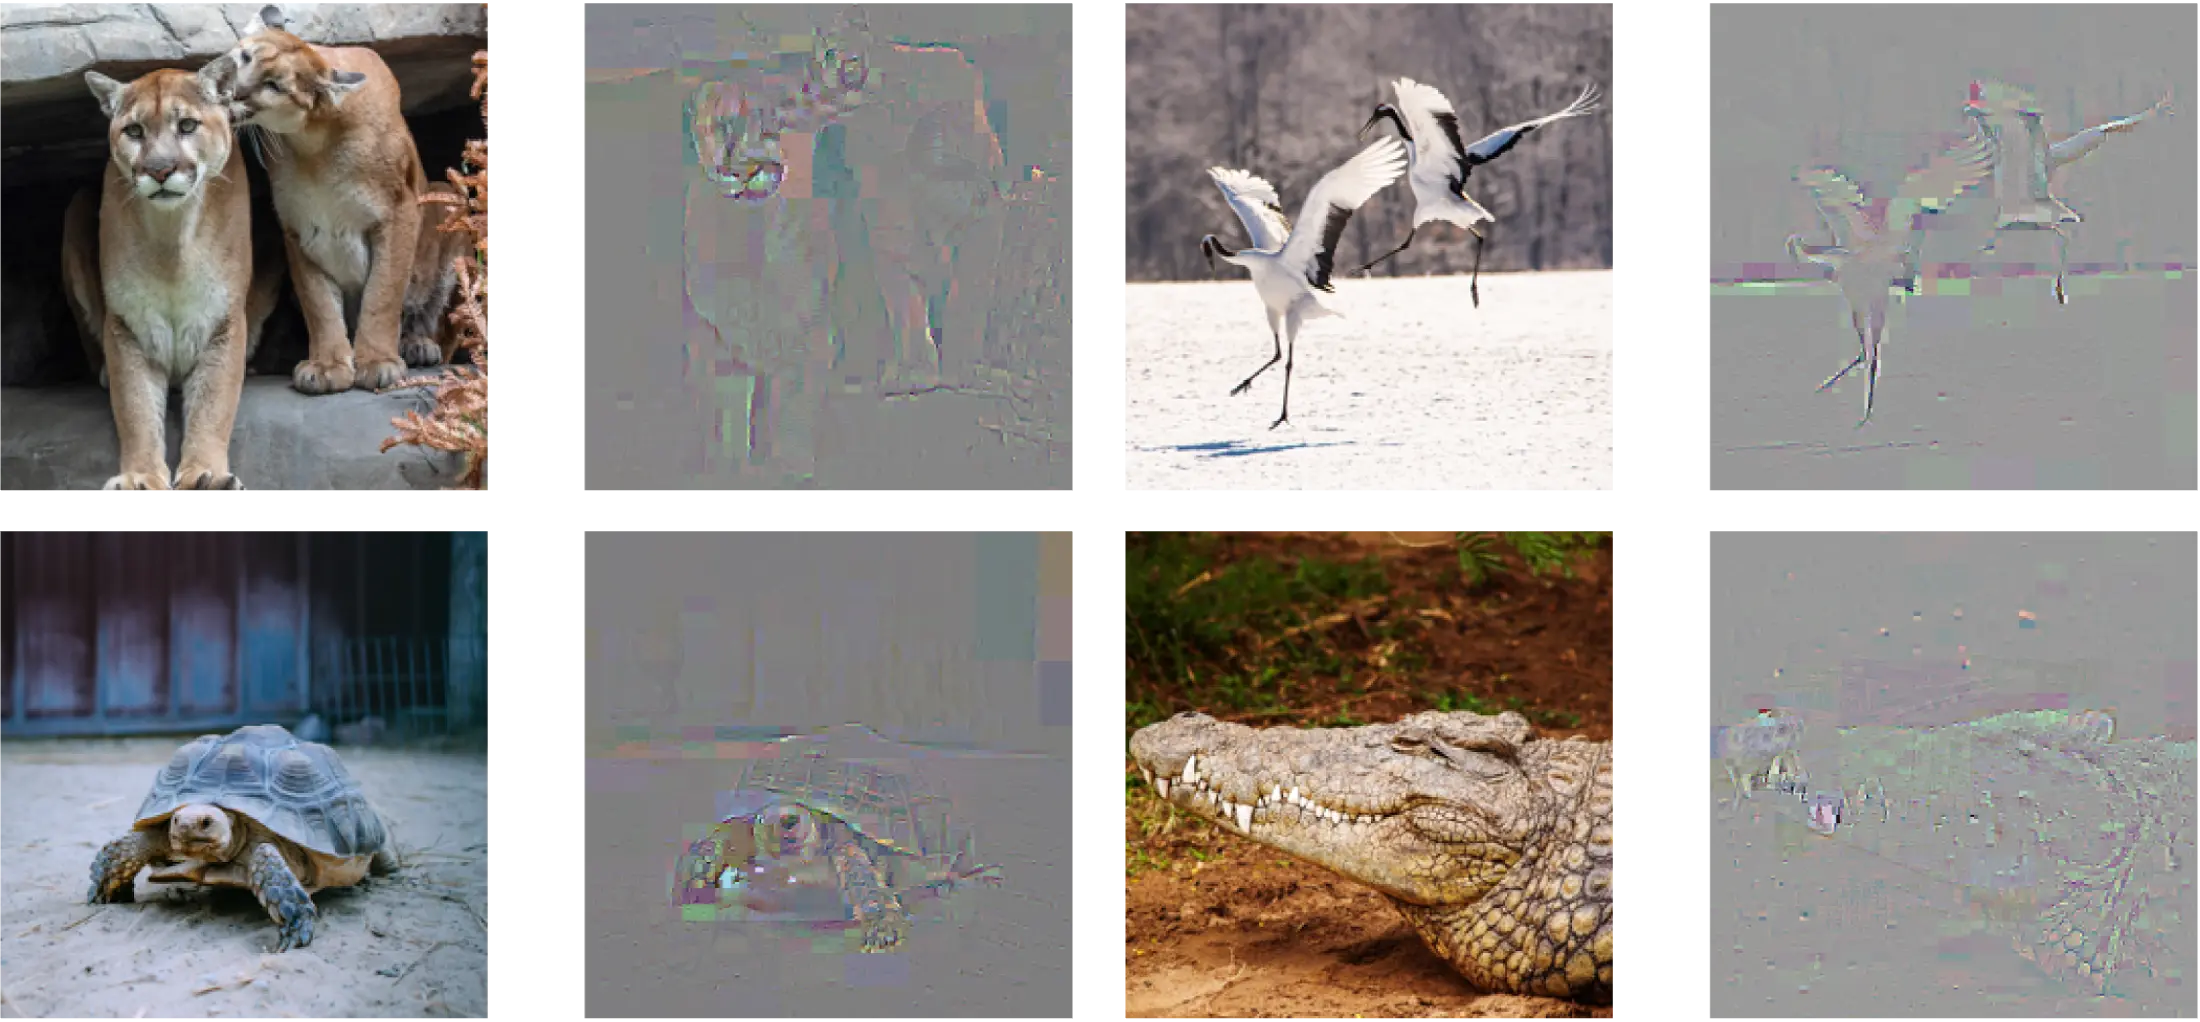
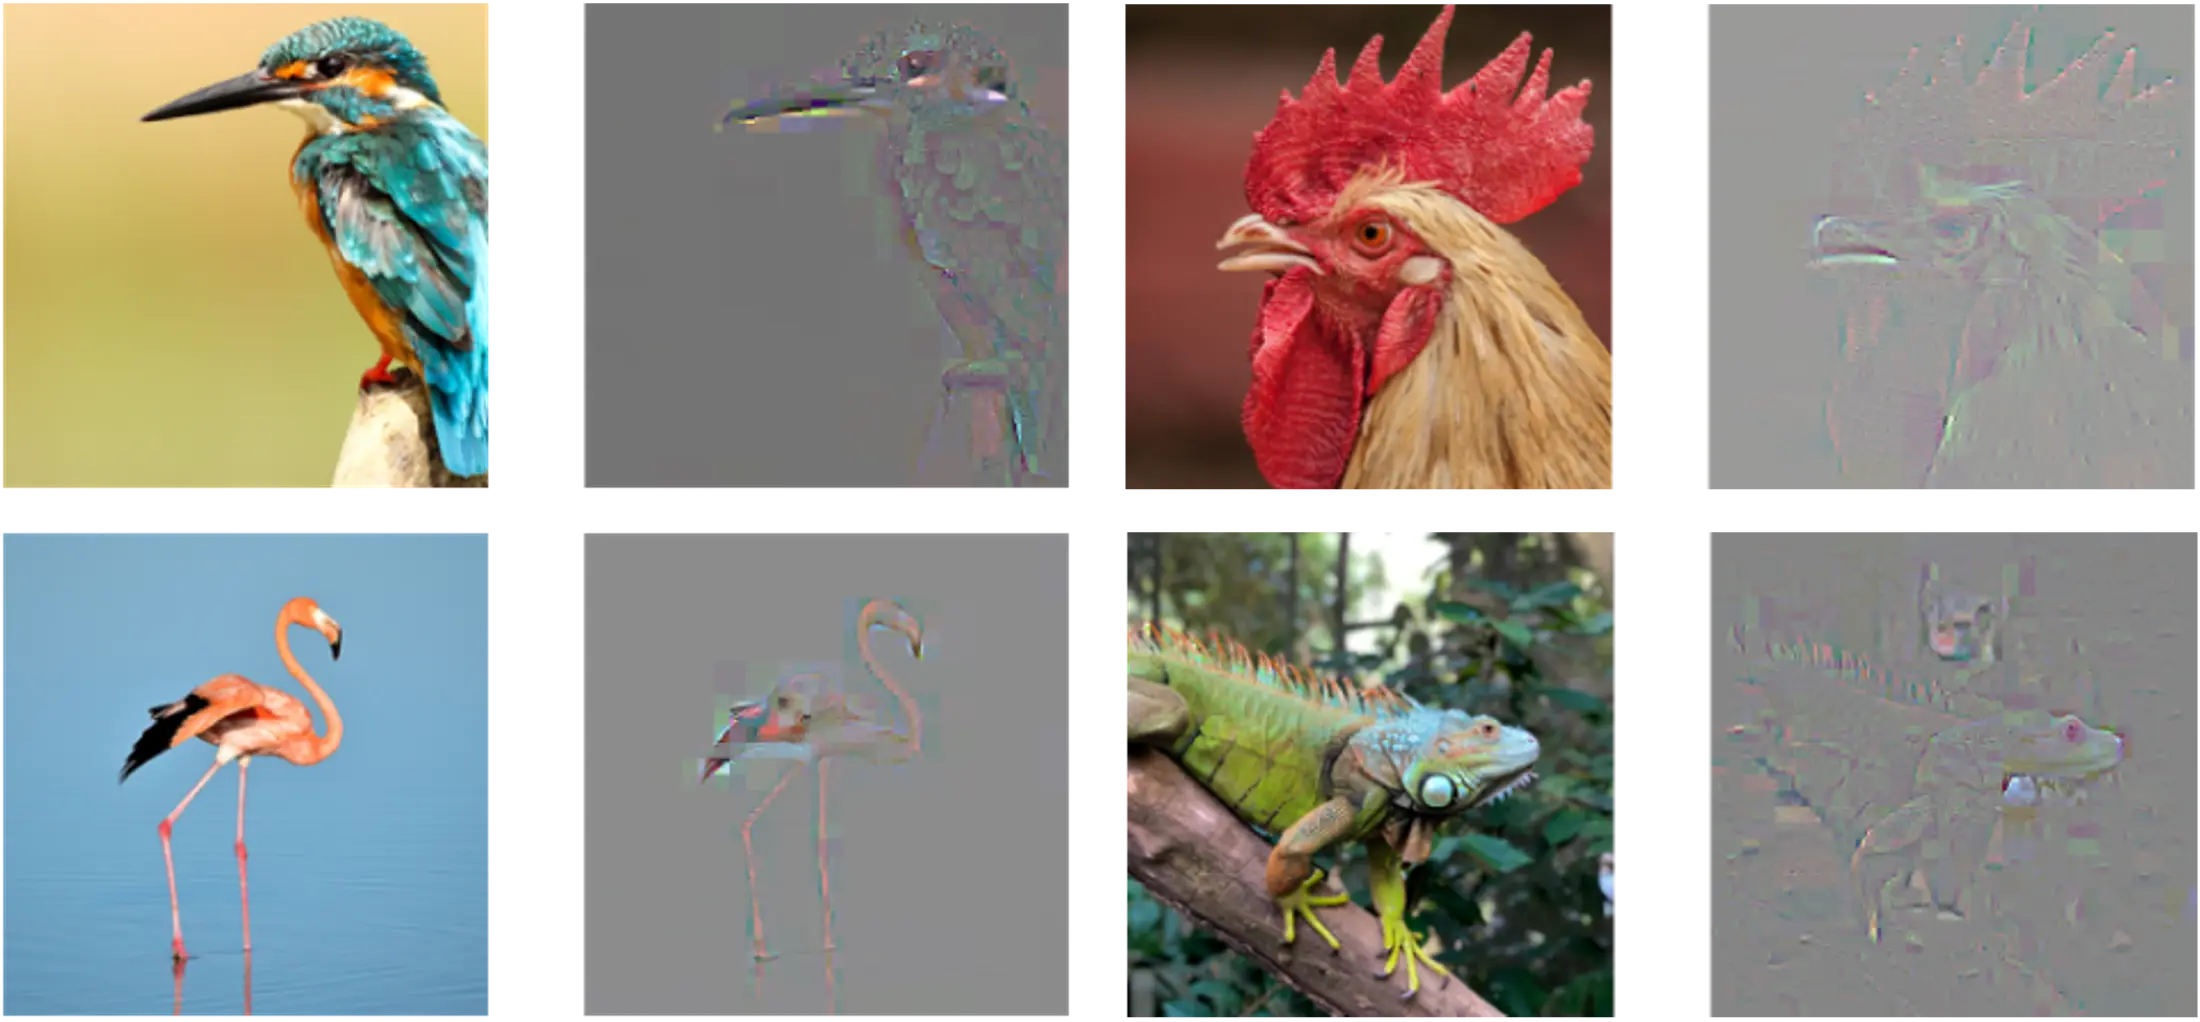
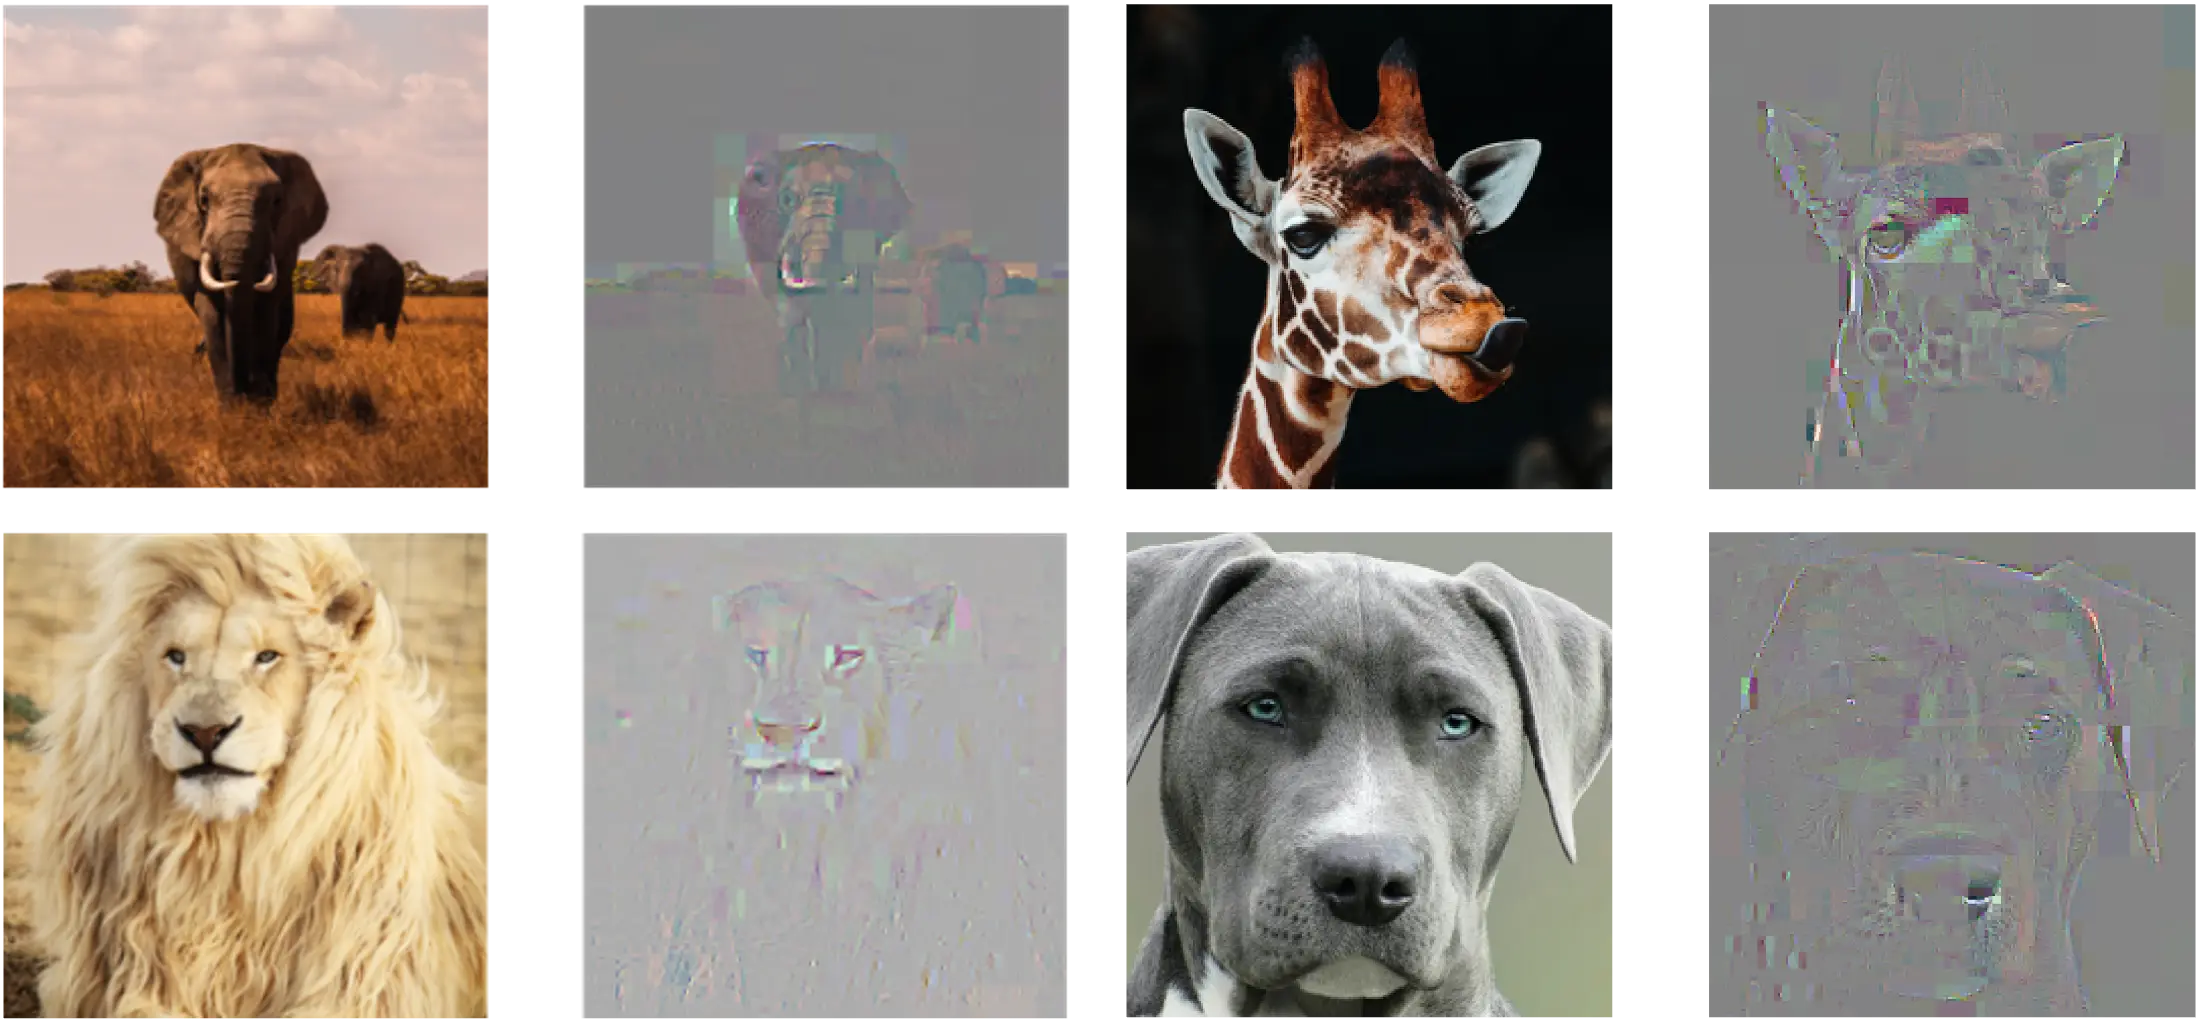
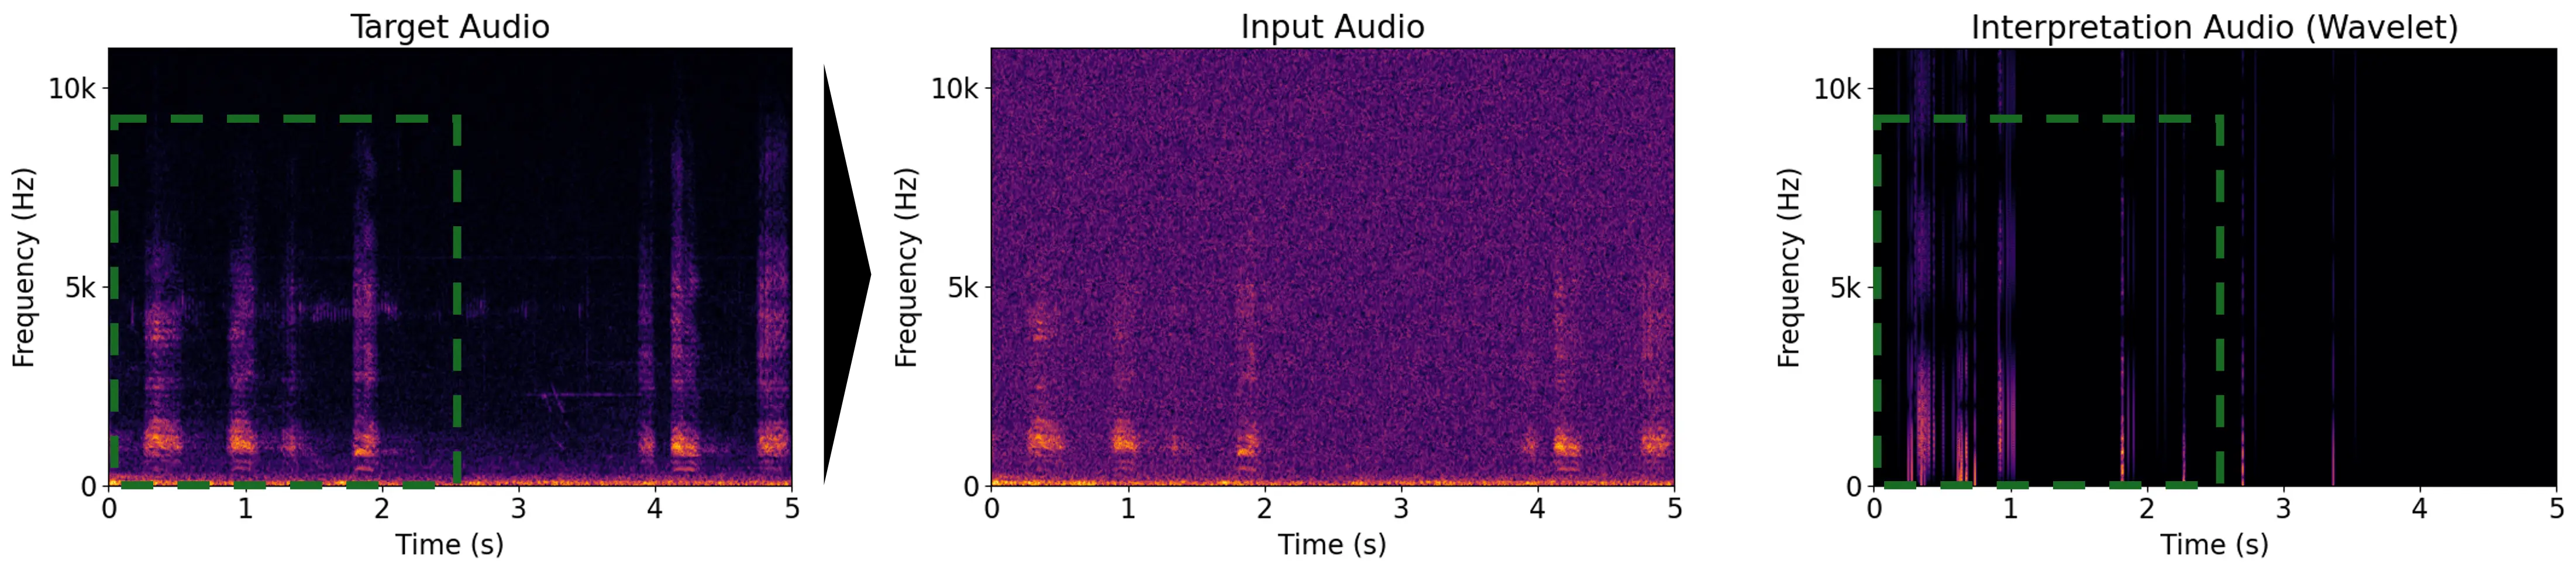
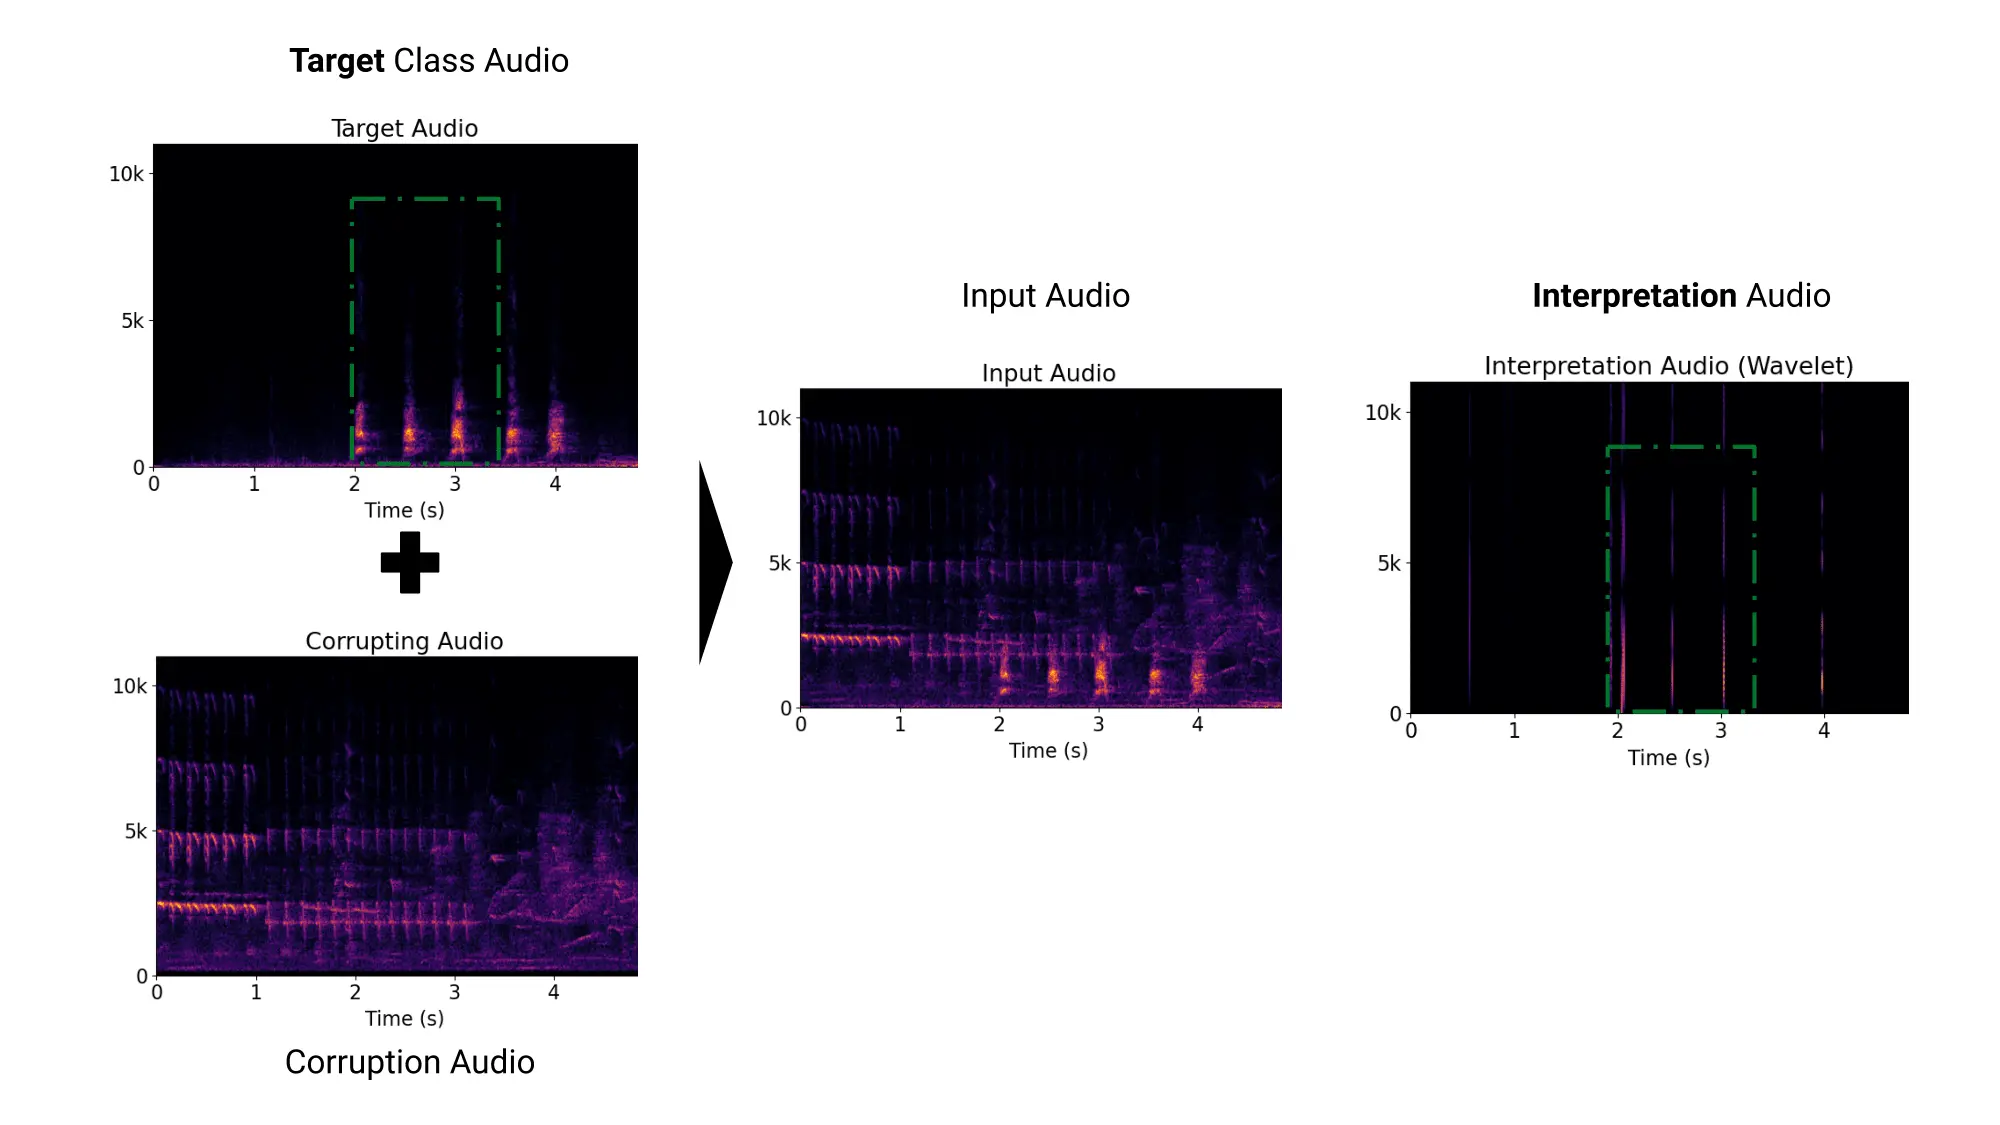
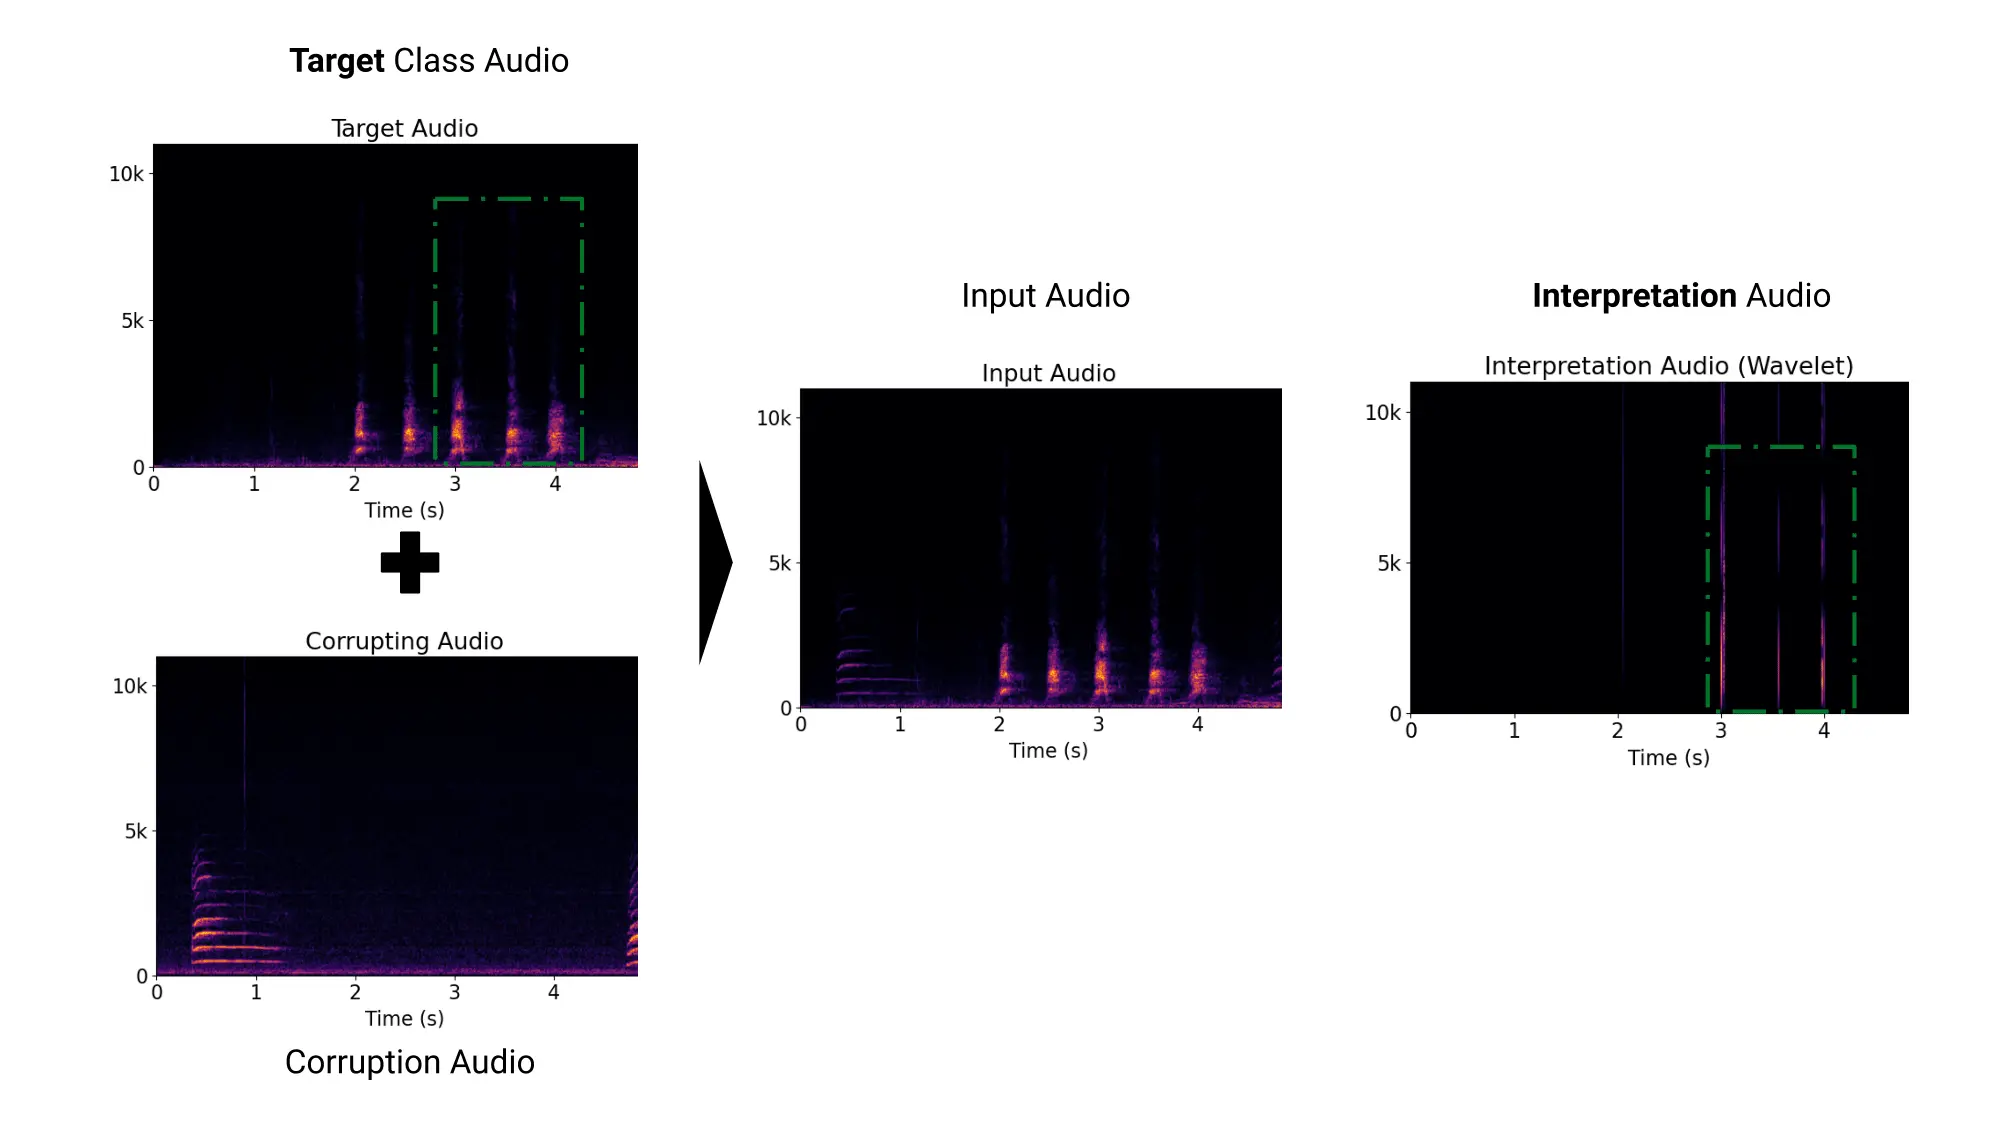
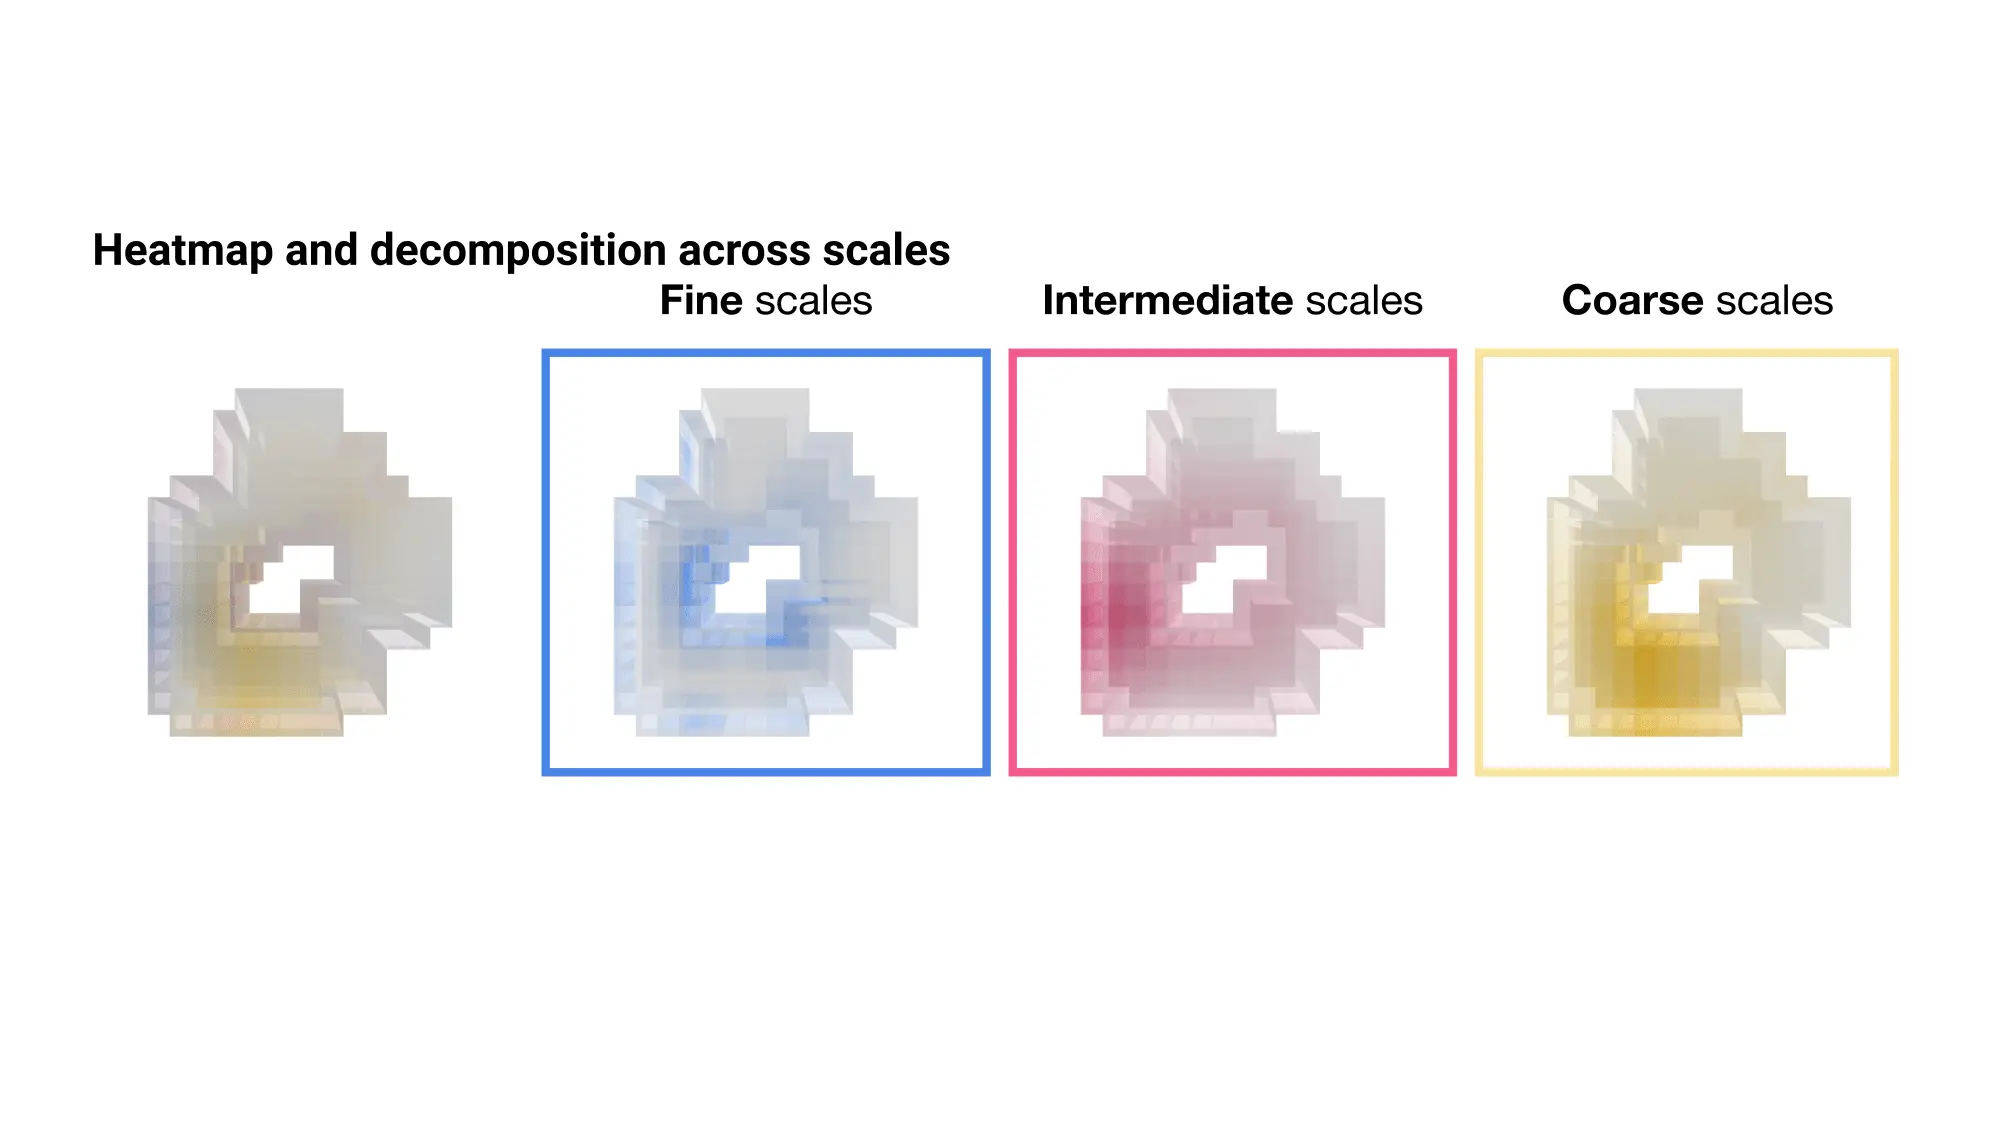
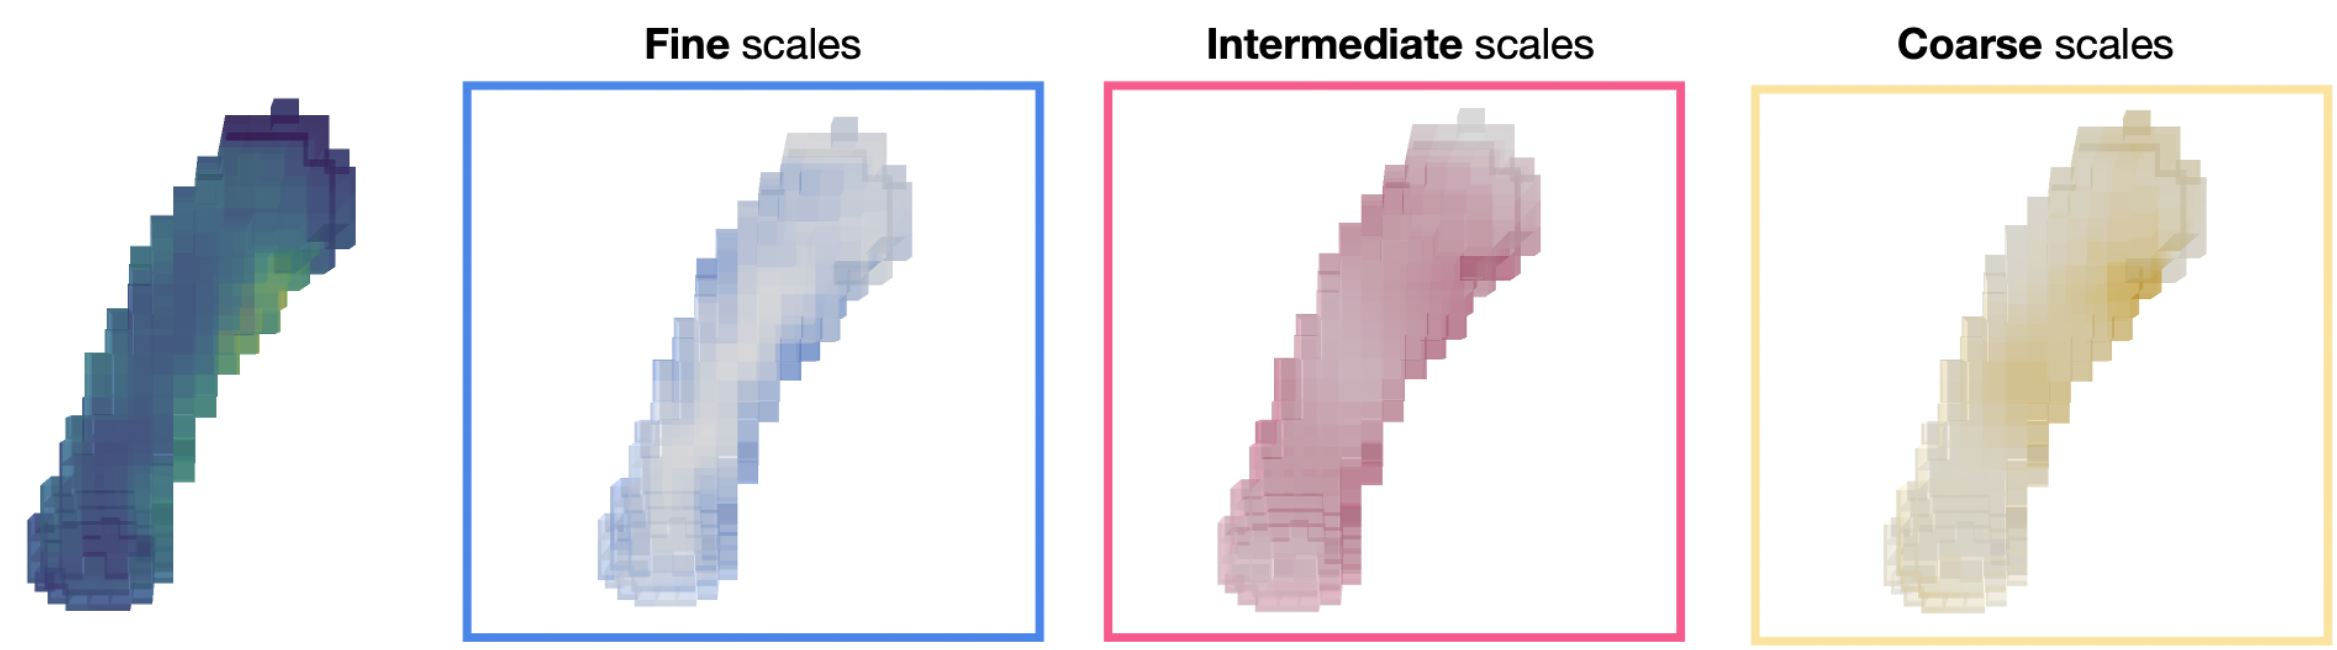
The figure below displays additional visualizations of WAM. From left to right: original image, WAM in the wavelet domain, heatmap in the pixel domain, filtered image illustrating the image regions that need to be well defined for the model to predict the image label correctly.